Experimental method of analysis
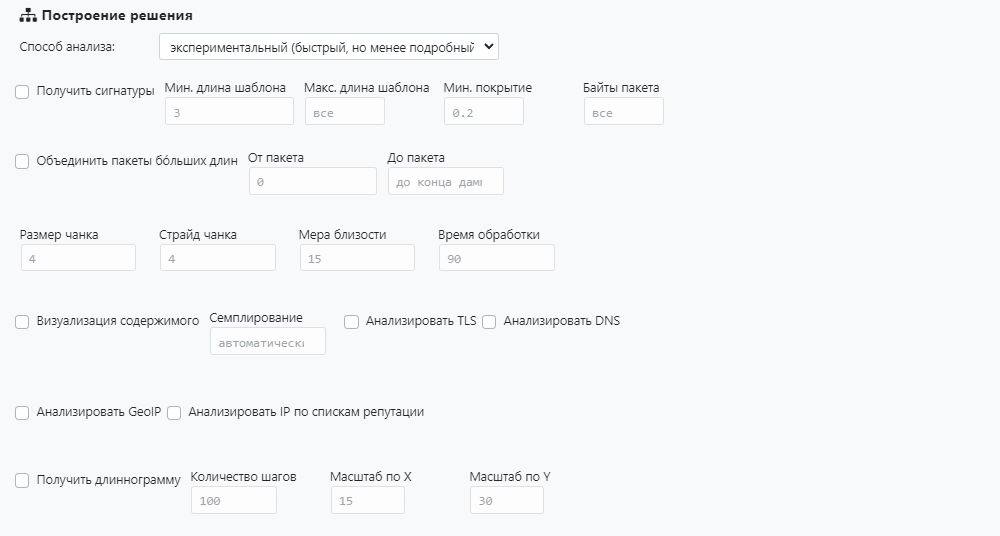
Analyzes L3/L4 headers and L4 payloads.
Works much faster than «Classic mode», , but does not always highlight templates.
You can specify the range of packets that will be analyzed by specifying values in the «From packet» and «To packet» fields.
For the experimental mode, you can activate the following checkboxes:
- «Get signatures» — add templates for L4 payload to the report (see Signatures);
- «Combine packets of greater length» — optimize the process of dump processing;
- «Content visualization» — allows you to visually determine patterns in traffic (see Content visualization);
- «Sampling» — only packets that are multiples of the specified value are used to build the visualization. For example, if «5» is specified, then every fifth package will be selected for rendering. In the «automatic» mode, the sampling value is determined by the engine in such a way as to evenly place the captured packets on the image with a maximum height of 200000 pixels;
- «Analyze TLS» — add analysis of TLS messages to the report;
- «Analyze DNS» — add DNS packet analysis to the report;
- «Analyze GeoIP» — add analysis by GeoIP bases to the report;
- «Analyze IP by reputation lists» — add analysis by reputation lists to the report;
- «Get longgram» — generate a longgram (see Longgram).
Signatures
This mechanism generates templates for L4 payload in various ways.
Template types:
- Patterns per payload lengths;
- Variable-Offset Patterns;
- Fixed Byte Mask;
- Common Submask;
- Merged Submask;
- Bloom filter signatures.
See the Report section for a detailed description of templates.
The user configures the following parameters:
- «Min. template length» — the minimum number of bytes that describes the template;
- «Max. template length» — the maximum number of bytes that describes the template;
- «Min. coverage» — the share of packets that the selected template should cover. For example, a value of 0.2 means a share of 20%. Applies to Variable-Offset Patterns, Patterns per payload lengths;
- «Packet bytes» — the length of the analyzed L4 payload from its beginning;
- «Chunk size» — the size of the elementary sequence for the Bloom filter in bytes;
- «Chunk stride» — the number of common bytes between the two nearest chunks;
- «Proximity measure» — a threshold number of common units between two Bloom filters to determine the similarity of packets;
- «Processing time» — the maximum time in seconds that the system will spend processing bloom filters.
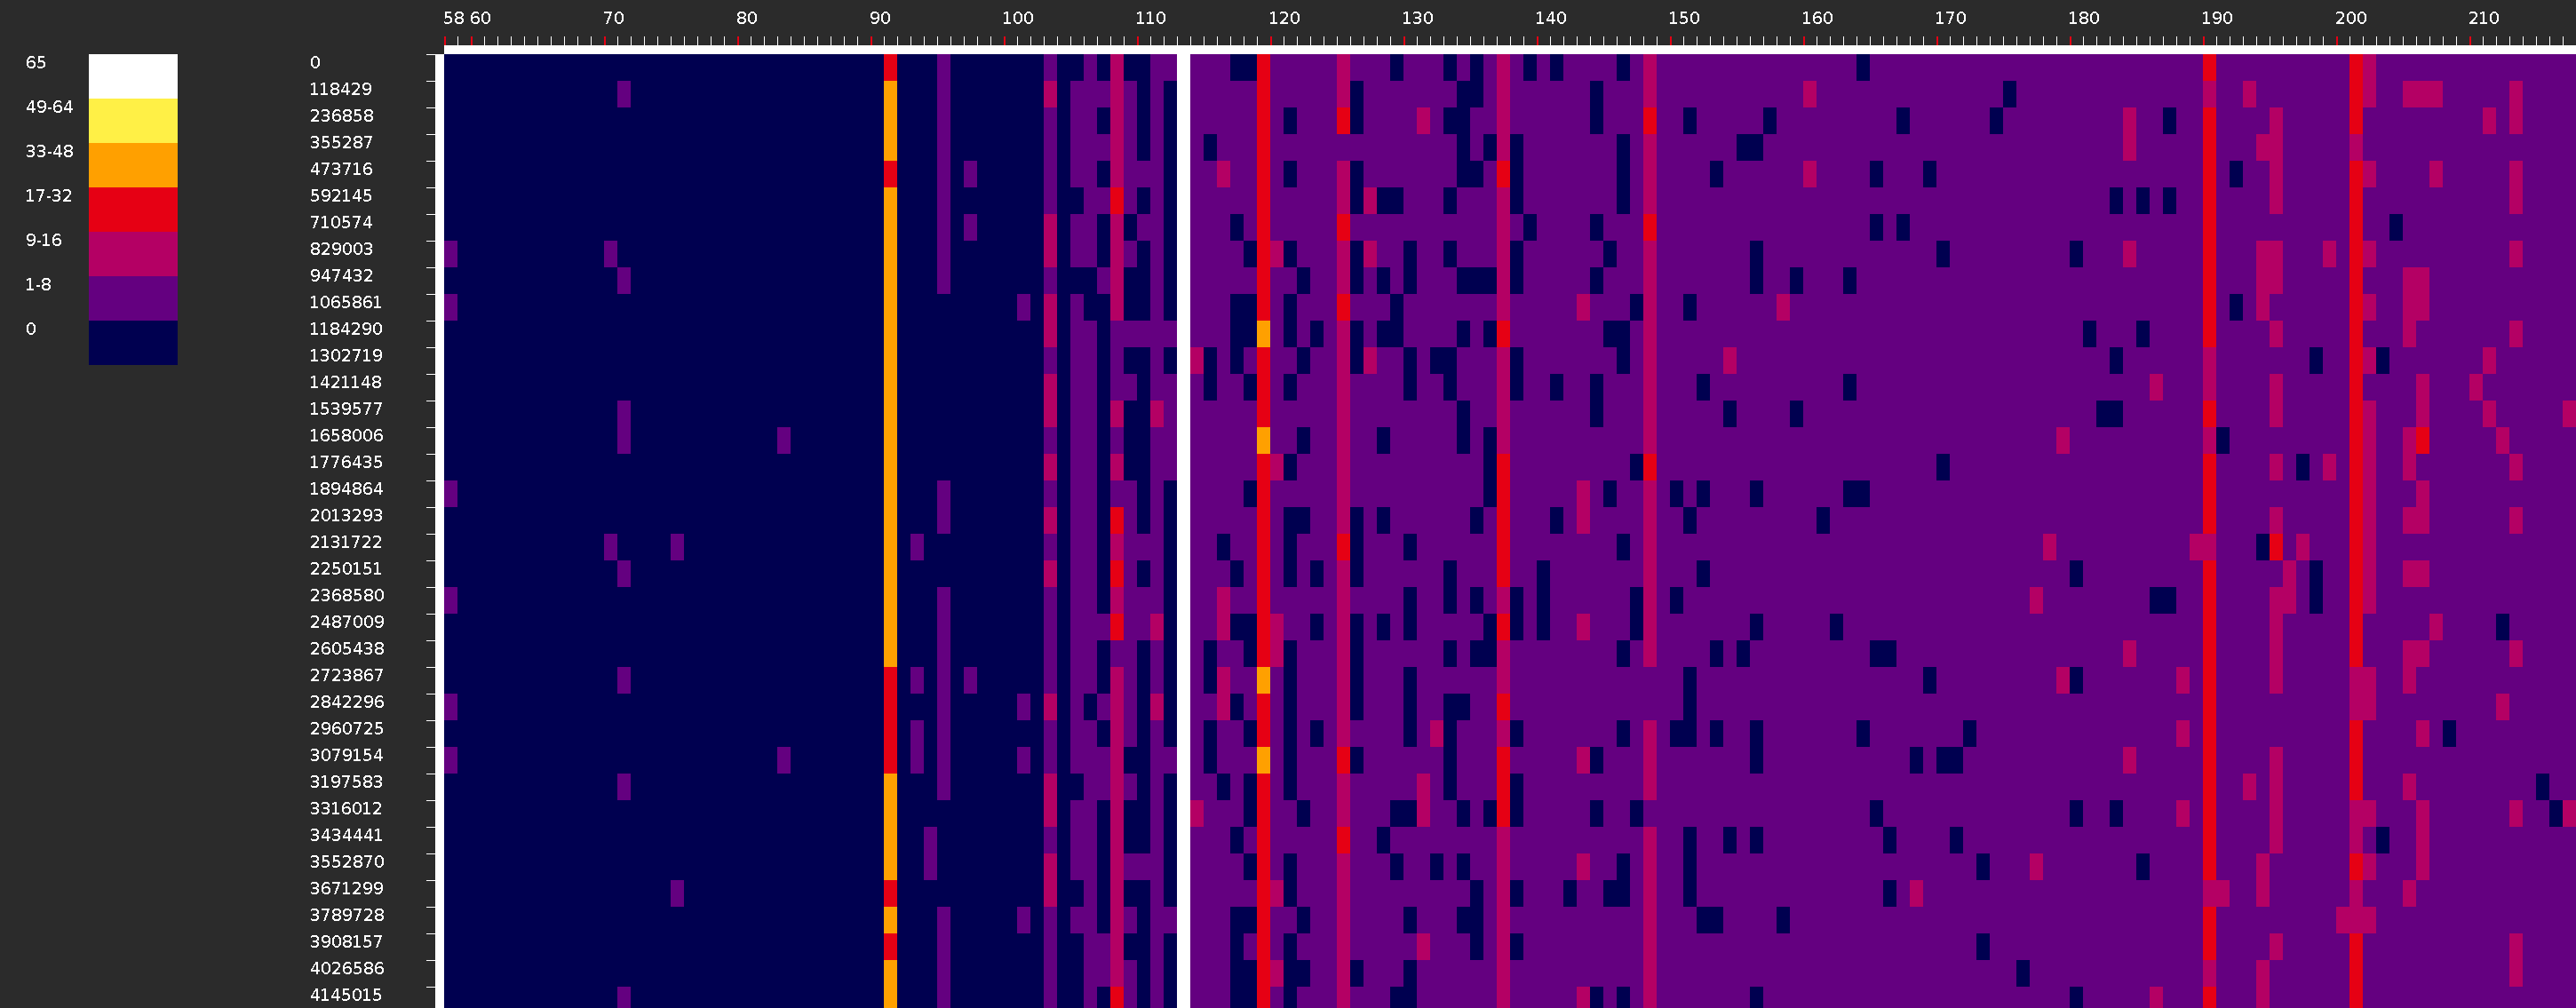
Content visualization
Content visualization can be useful for understanding the structure of traffic, as it allows you to visually identify patterns in it. The dump is represented as a graphic image, in which each line is L3/L4 packet data. Byte values are color coded.
When unloading the archive, the user receives a set of dump visualization files:
- sampling#_gray256_sorted_L4.png;
- sampling#_gray256_sorted_L3_L4.png;
- sampling#_gray256_chrono_L4.png;
- sampling#_gray256_chrono_L3_L4.png;
- sampling#_color256_sorted_L4.png;
- sampling#_color256_sorted_L3_L4.png;
- sampling#_color256_chrono_L4.png;
- sampling#_color256_chrono_L3_L4.png.
The file name tells about the visualization construction method:
- sampling# — shows the sampling value, set by the user or automatically determined by the rendering engine;
- sorted — packages are sorted by payload size in ascending order;
- chrono — packets are arranged in the same order in which they are captured in the dump (i.e. if the image is rotated 90 degrees counterclockwise, then you get a classic representation of time graphs);
- L4 — only for L4 payload;
- L3_L4 — L3 headers + L4 headers + L4 payload;
- gray — representation in shades of gray (close byte values visually differ slightly);
- color — representation in color (similar byte values are clearly distinguishable visually).
Color256_chrono_L4 visualization example:
 Gray256_sorted_L3_L4 visualization example::

Longgram
The mechanism allows you to get a longgram - an image showing the distribution of the size of packets by their number over a certain time interval.
The vertical axis shows time intervals from the minimum to the maximum packet capture time in microseconds. The number of intervals is set in the «Number of steps» field. The horizontal axis shows the packet sizes in bytes. The color indicates the number of packets of a certain length in a certain time interval.
The size of a dot on a longgram is set in pixels by specifying the values in the Scale in X» and «Scale in Y» fields.
Similar to the chrono visualization, if the image is rotated 90 degrees counterclockwise, you get a more familiar representation for a spectrogram.
Report
The report consists of sections:
-
Summary;

- Packets — the number of packets in the dump;
- File — path to the dump file;
- Treat large lengths as one — a sign of combining packets of the largest lengths.
-
Capture info;

- Capture begin — date and time of the beginning of capture;
- Capture end — date and time of the end of capturing;
- Capture duration — the duration of the capture.
-
Header Analysis;
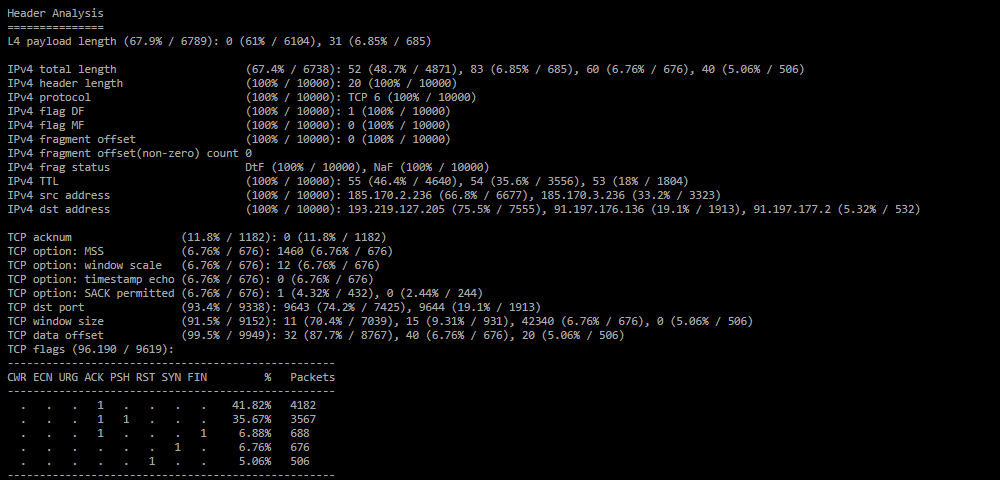
Analysis of common field values in IPv4 headers and transport protocols. Relevant if the attacker does not randomize protocol headers. Values are shown only if the proportion of packets of a certain protocol in the dump is 5% or more. The distribution of fragmented packets with a non-zero offset in the IP header and the number of unique non-zero offsets are shown. A table of distribution of TCP flags by the number of packets is also formed.In the IPv4 frag status field, the distribution of fragmentation flags in the ACL syntax is formed.
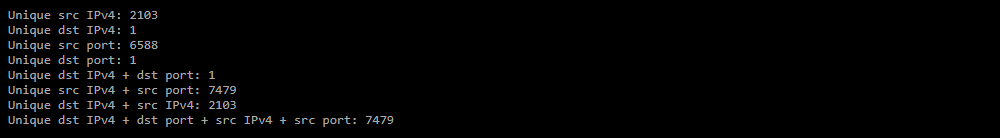
NaF – (Not a fragment) the packet is not a fragment;
Dtf – (Don't fragment) fragmentation prohibition;
IsF – (Is a fragment)  the packet is a fragment;
FF  – (First fragment) attribute of the first fragment;
LF  – (Last fragment)  attribute of the last fragment;
A list of unique n-tuple combinations is formed.
-
TLS Analysis;
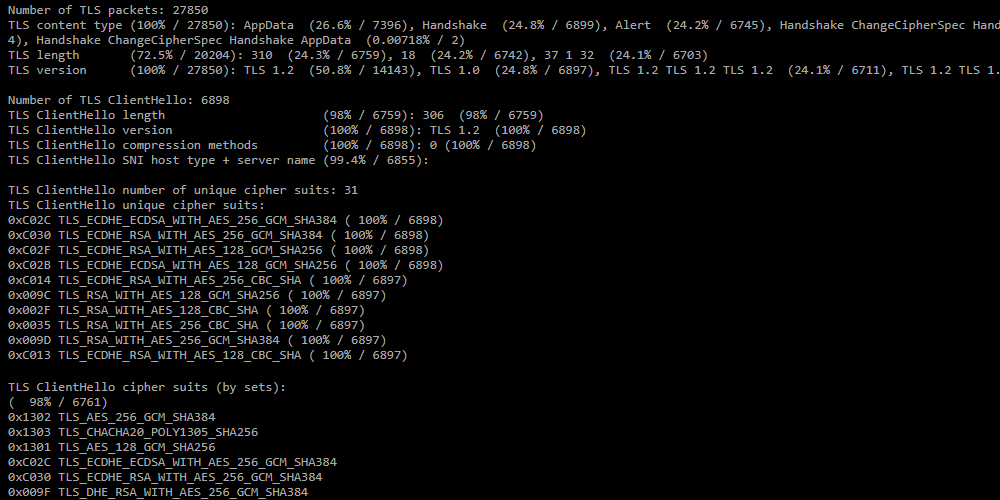 The section is generated in the report if the «Analyze TLS» checkbox is set.
- Number of TLS packets — the number of TLS packets in the dump;
- TLS content type — distribution of TLS messages by the number of packets;
- TLS length — distribution by TLS packet length;
- TLS version — distribution by TLS version;
- Number of TLS ClientHello — number of ClientHello messages;
- TLS ClientHello number of unique cipher suits — number of unique
cipher suits in ClientHello messages; - TLS ClientHello unique cipher suits — a list of unique cipher suites;
- TLS ClientHello cipher suits (by sets) — distribution of ClientHello by combination of cipher suits;
- TLS ClientHello number of unique extensions — number of unique extensions;
- TLS ClientHello unique extensions — list of unique extensions;
- TLS ClientHello extensions (by sets) — distribution of ClientHello by combination of extensions sets.
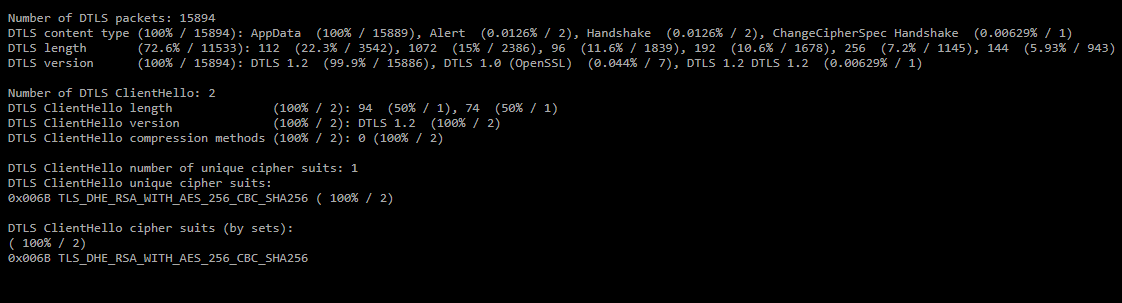 The report also displays statistics on DTLS over UDP.
- Number of DTLS packets — number of DTLS packets in the dump;
- DTLS content type — distribution of DTLS messages by the number of packets;
- DTLS length — distribution by length of DTLS packets;
- DTLS version — distribution by DTLS version;
- Number of DTLS ClientHello — number of ClientHello messages;
- DTLS ClientHello number of unique cipher suits — number of unique cipher suits in ClientHello messages;
- DTLS ClientHello unique cipher suits — list of unique cipher suits;
- DTLS ClientHello cipher suits (by sets) — distribution of ClientHello by combination of cipher suits.
- Number of TLS packets — the number of TLS packets in the dump;
-
DNS Analysis;

 The section is generated in the report if the Analyze DNS» checkbox is set.
The data in the report is grouped in triplets, each containing a domain name, a class, and a query type. The percentage of packets in each category is taken from the total number of DNS packets in the dump. To display a triple in the report, the number of DNS packets of one set must exceed 5% of the threshold of the number of DNS packets of the category.- Number of DNS packets — the number of DNS packets in the dump;
- DNS UDP query — distribution of DNS packets with query type message sent via UDP;
- DNS UDP response — distribution of DNS packets with the response type message sent via UDP and related to the questions section;
- DNS TCP query — distribution of DNS packets with query message type sent via TCP;
- DNS TCP response — distribution of DNS packets with the response type message sent over TCP and related to the questions section.
-
Geo Analysis;
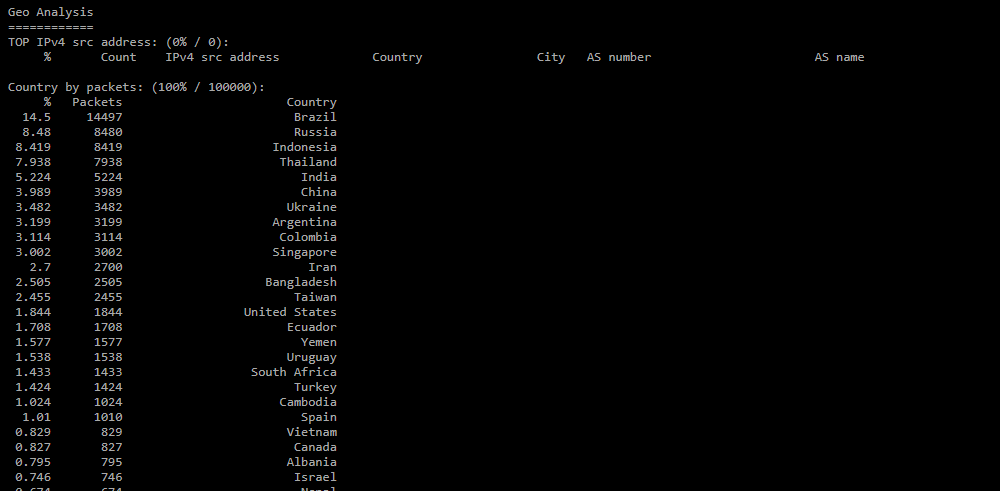
The section is generated in the report if the «Analyze GeoIP» checkbox is set.- TOP IPv4 src address — top IP addresses by frequency of their appearance in the dump. Each address has a country, city, name, and autonomous system number;
- Country by packets — distribution of countries by the number of packets;
- Country by IPv4 count — distribution of countries by the number of sender IP addresses;
- AS by packets — distribution of autonomous systems by the number of packages;
- AS by IPv4 count — distribution of autonomous systems by the number of sender IP addresses.
-
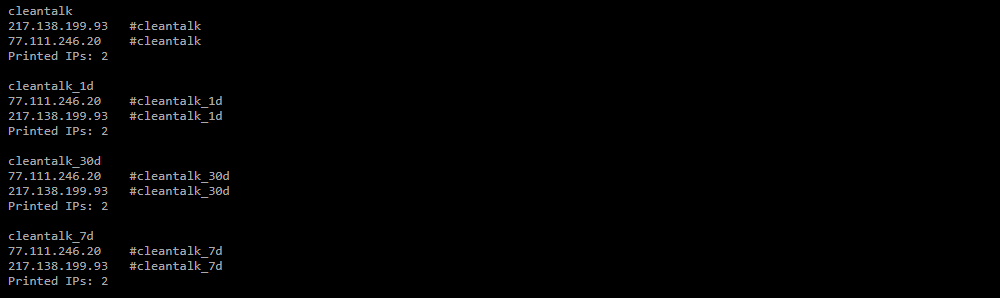
IP lists Analysis;
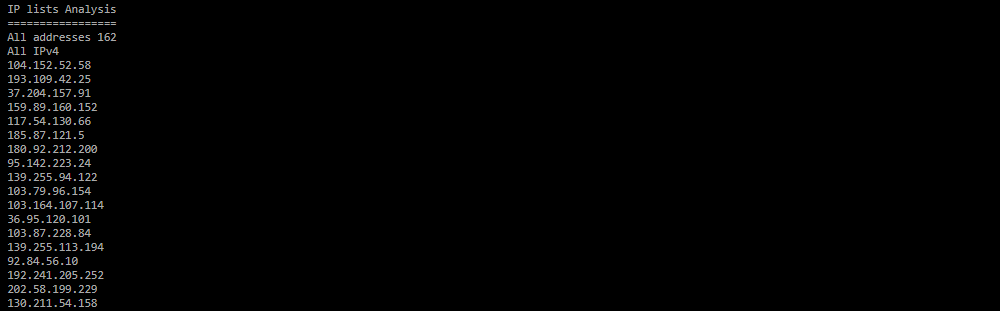
Analysis of the IP addresses of the dump by reputation lists. The section is generated in the report if the checkbox «Analyze IP by reputation lists» is set.The section contains a list of all IP addresses for which an entry into the reputation lists of this category was found, then an entry for each list with an indication of the name of the list and the number of entries;
-
Custom IP lists Analysis;
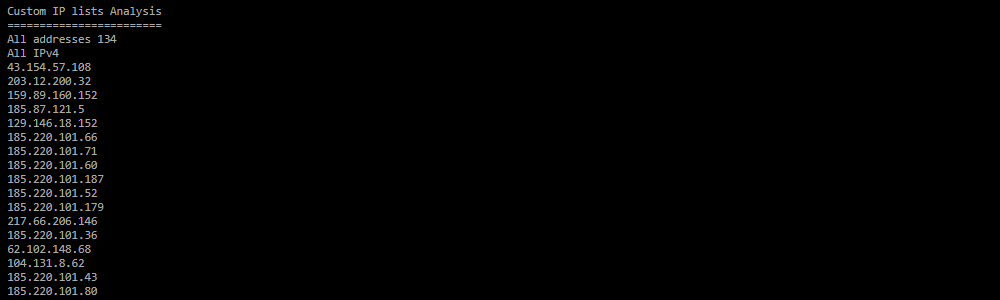 Analysis of the IP addresses of the dump by additiona; reputation lists. The section is generated
in the report if the checkbox «Analyze IP by reputation lists» is set.
Analysis of the IP addresses of the dump by additiona; reputation lists. The section is generated
in the report if the checkbox «Analyze IP by reputation lists» is set.The section contains a list of all IP addresses for which additional reputation lists were found, then an entry for each list, then an entry for each list, indicating the name of the list and the number of entries;
-
SS feed IP lists Analysis;
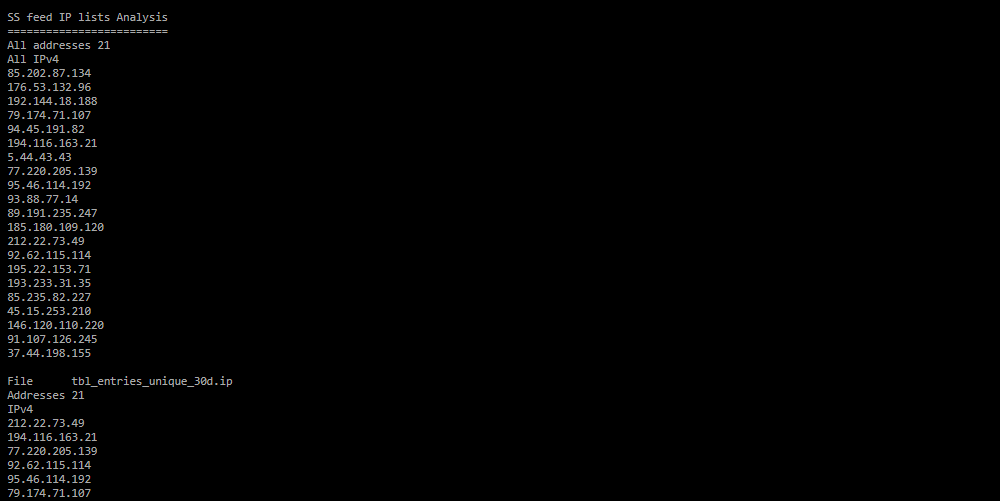 Analysis of dump IP addresses by reputation lists from the statistics server.
The section is generated in the report if the checkbox «Analyze IP by reputation lists» is set.
Analysis of dump IP addresses by reputation lists from the statistics server.
The section is generated in the report if the checkbox «Analyze IP by reputation lists» is set.The section contains a list of IP addresses that were found to be included in the reputation lists generated on the statistics server for various time intervals, then an entry for each list;
-
TCP SYN;
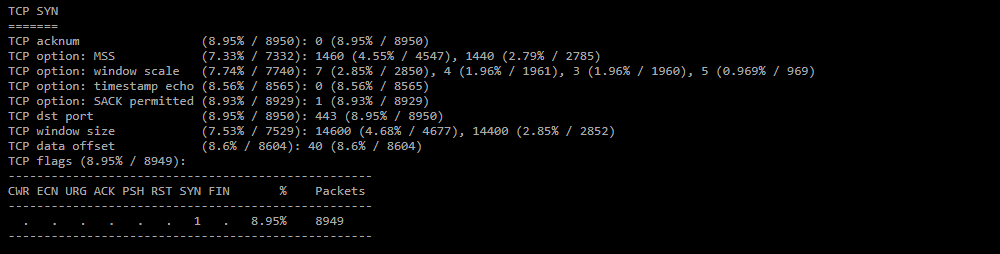
Statistics on TCP headers for SYN packets. -
TCP SYN+ACK;
Statistics on TCP headers for SYN+ACK packets is similar to statistics for SYN packets. -
Patterns per payload lengths;
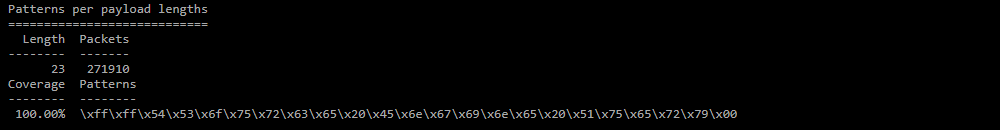
Frequently observed patterns for packets with the most frequently occurring length. -
Variable-Offset Patterns;

Frequently observed patterns in payload with variable offset. -
Fixed Byte Mask;
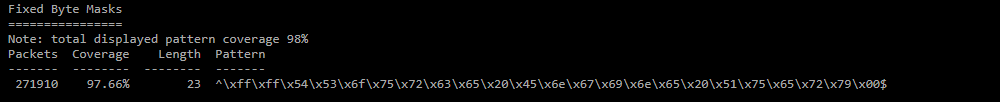
Offsets at which the value of a byte is fixed, a set of such offsets and values at them forms a mask. -
Common Submask;
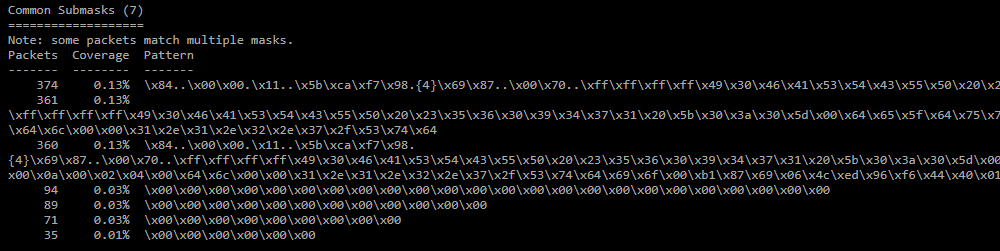
Similar masks are searched for (50% match of regular expressions), and the common part is selected from them. -
Merged Submask;
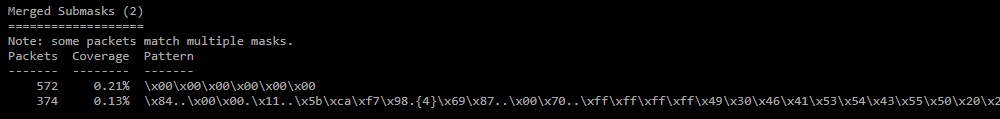
Merged Submasks are formed by removing redundancy from common submasks, for example, aabb is covered by aab and only aab remains. -
Bloom filter signatures;
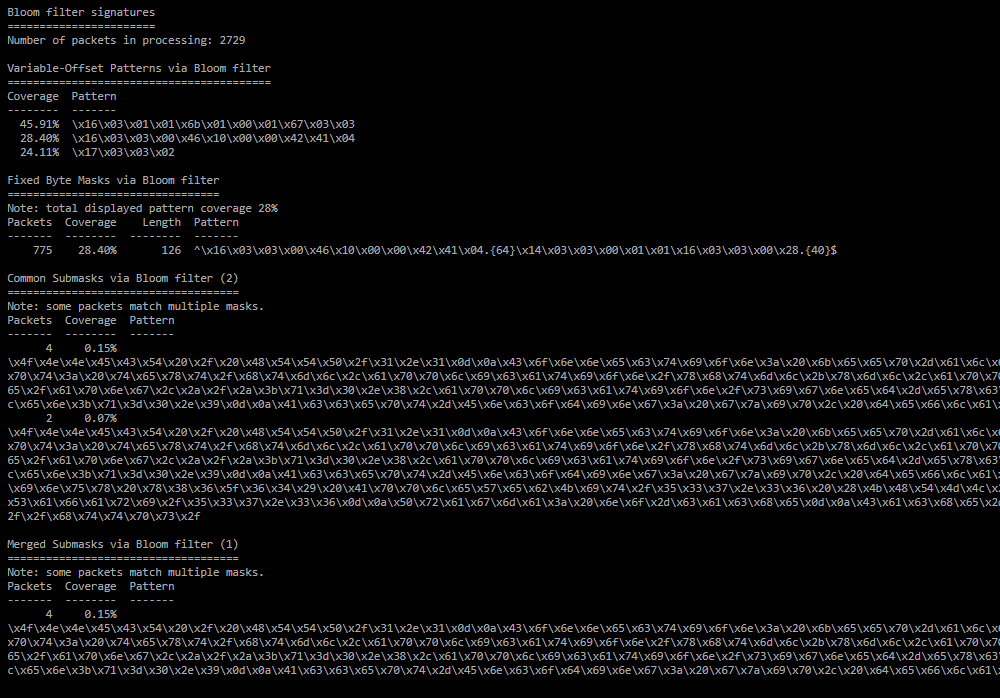
List of signatures for similar packets found using Bloom filters.- Number of packets in processing - the number of packets among which similar ones were selected;
- Variable-Offset Patterns via Bloom filter - Variable-Offset Patterns for similar packages;
- Fixed Byte Masks via Bloom filter - Fixed Byte Mask for similar packets;
- Common Submasks via Bloom filter - Common Submask for similar packages;
- Merged Submasks via Bloom filter - Merged Submask for similar packages.