(WIP) Web server Log Analyzer
The accesslog subsystem is currently in beta testing.
The subsystem is an additional licensed module.
An accesslog subsystem has been added to MITIGATOR, which, by analyzing the logs of the protected Web server (HTTP, HTTPS), detects anomalies and attacking addresses.
Protected servers send their logs to the Analyzer using syslog RFC 3164 (UDP, TCP, TLS).
The analyzer can be installed on one of the MITIGATOR instances, as one of its subsystems, or located separately on an external server.
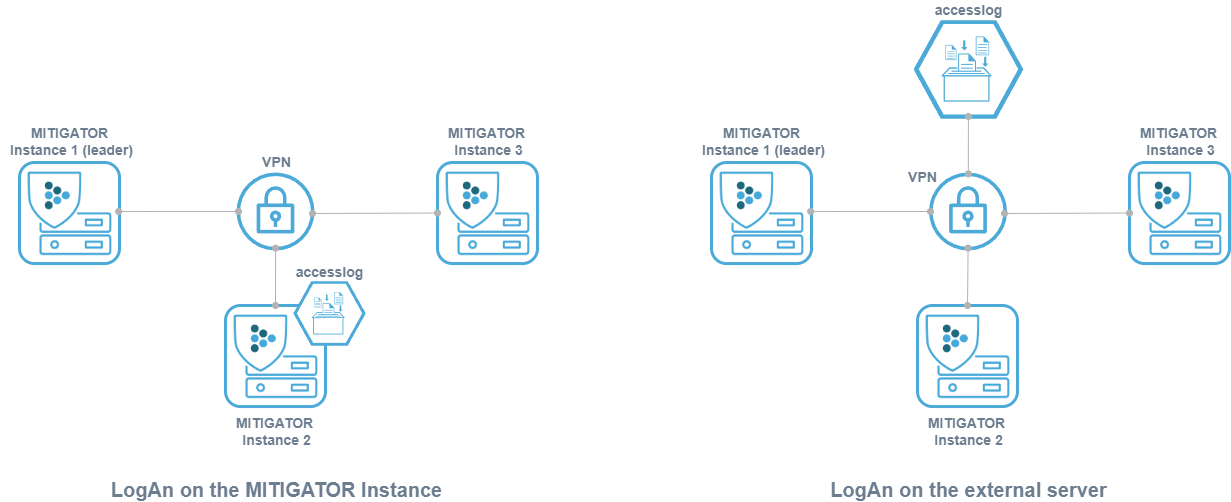
Analyzer on MITIGATOR instance
The following steps assume that an instance of MITIGATOR has already been installed. Otherwise, install one of methods first.
To enable accesslog on a permanent basis, you need to change the value of the scale parameter from 0 to 1
in docker-compose.yml.
services:
  ...
  accesslog:
    ...
    scale: 1
    ...
After configuration, you need to restart MITIGATOR:
docker-compose down && docker-compose up -d
Analyzer on an external server
External server setup
It is assumed that Docker, docker-compose and wireguard-dkms are already installed on the external server.
-
Create
docker-compose.ymlon the server for the accesslog subsystem:mkdir -p /opt/mitigator-accesslog -
Download
docker-compose.yml:wget https://docs.mitigator.ru/v22.06/dist/accesslog/docker-compose.yml \ -O /opt/mitigator-accesslog/docker-compose.yml -
Create a service to run the subsystem on the external server:
Download the service file:
wget https://docs.mitigator.ru/v22.06/dist/docker-compose@.service \
    -O /etc/systemd/system/docker-compose@.service
Activate the service:
systemctl enable docker-compose@mitigator-accesslog -
Run the services on the external server:
-
Enter docker.mitigator.ru
docker login docker.mitigator.ru -
Go to the work directory
cd /opt/mitigator-accesslog -
Download the images
docker-compose pull -
Run the service
systemctl start docker-compose@mitigator-accesslog
-
-
Check the connectivity between the analyzer server and the MITIGATOR instances:
-
Run command
docker-compose exec gateway wg -
Make sure there is a handshake between all members of the VPN network.
-
Setting up interaction with MITIGATOR via VPN
MITIGATOR instances communicate through Wireguard, a virtual network (VPN) is created between them. In order for accesslog to communicate with the MITIGATOR system, you must configure VPN for it, as well as for all instances within the cluster.
At the request of the user, the names of the variables MITIGATOR_VPN_ADDRESS and
MITIGATOR_VPN_PREFIX for the accesslog can be changed to more appropriate ones.
It is recommended that you choose an intra-VPN address for accesslog that is separate from instance
addresses, such as 10.8.3.254. In this case, all addresses must be within the same
/24 network.
Configuration in the Web interface
For the log analyzer to work both on the MITIGATOR instance and on an external
server, you must specify the address and port inside the VPN through which
the log analyzer is available. The address and port are set as 10.8.3.254:7200 on the
“System Setup” page in the “General Protection Parameter” card.
Configuring the sending of logs on the web server
The analyzer receives logs on ports:
- 7201 – UDP;
- 7202 – TCP;
- 7203 – TLS over TCP.
Sending logs with NGINX
NGINX allows to immediately send its logs over syslog without using any third-party applications (syslog-ng, rsyslog).
-
By default, nginx uses the “combined”, log format, which does not contain information about the processing time of the request
$request_time. You can define custom log format in/etc/nginx/nginx.conffile.log_format myformat '$remote_addr - $remote_user [$time_local] "$request" $request_time $status $body_bytes_sent "$http_referer" "$http_user_agent"';Where
myformatis the name of the log format. -
In the site settings file, for example,
/etc/nginx/sites-enabled/default, set:access_log syslog:server=192.0.2.1:7201,tag=123456789abcdefg myformat;Here
server=192.0.2.1:7201is the IP address and the port of the log analyzer.Through
tag=a secret identifier (token) is set, which allows you to
determine which service the entry in the log belongs to, it is known only to administrators of the protected service and protection policies. The token must contain 16 characters. iftag=is empty, then MITIGATOR uses the IP address from which the access_log is sent as a token.access_log syslog:server=10.10.10.4:7201,tag= myformat; -
Restart NGINX.
systemctl restart nginx
NGINX behind PROXY
If the nginx of the protected server is located behind a proxy or traffic balancer,
then substitution of real IP addresses of senders from the
X-Forwarded-For header must be configured. This requires the presence of the http_realip_module module in nginx.
You can check that the http_realip_module module is installed using the command:
2>&1 nginx -V | tr -- - '\n' | grep http_realip_module
If the module is not installed, you should
reassemble nginx
with --with-http_realip_module parameter.
In the /etc/nginx/nginx.conf file on the protected server in the http section:
- Add the IP address of the Proxy server to the list of trusted:
set_real_ip_from 192.168.0.1/32;
Here 192.168.0.1/32 is the IP address of the Proxy server.
- Set “X-Forwarded-For” header as source
real_ip_header X-Forwarded-For;
In the /etc/nginx/nginx.conf file on the Proxy server in the server section:
- Configure real address sending in
X-Real-IP header
proxy_set_header X-Real-IP $remote_addr;
Sending Logs with Syslog-ng
Approximate file configuration /etc/syslog-ng/conf.d/mitigator_log.conf
is listed below:
source s_source {
file("/var/log/nginx/access.log" flags(no-parse));
};

destination d_MITIGATOR {
syslog("10.10.10.4" transport("udp") port(7201));
};

log {
source(s_source);
destination(d_MITIGATOR);
};