Version v26.04
Update to version v26.04 must be performed according to special instructions.
Version v26.04 adds: automatic packet capture in General Protection, ISN-agent improvements, dynamic sFlow sampling, Flow/SNMP ratio page in Collector, GRE traffic processing distribution mode across cores, traffic bypass mode above the license bandwidth, traffic graphs from internal network in protection policies, updated PostgreSQL version.
The functionality of WL, WL6, ACL, ACL6, ACLI, LACL, LACL6, SCAN, ATLS, ITLS, SPLI, DNS, DNS6, TCP6, USF, BPF, LIM countermeasures has been expanded, as well as Collector, HPD, PCAP, “Overview” page, “Flow Analysis” page, “Event Log”, and named filter rule sets.
Multiple UX improvements made.
Changes in v26.04.3
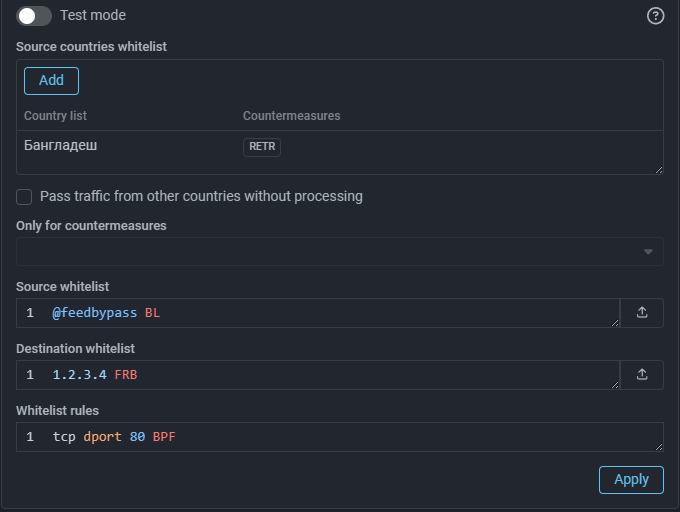
The WL countermeasure in General Protection and protection policies now supports bypassing traffic using rules similar to ACL rules.
Like other WL filters, per-countermeasure bypass is supported in the rules. Labels for excluding a packet from processing by specified countermeasures accumulate. This means that when a packet matches multiple filters simultaneously, but different filters specify different sets of countermeasures that should not process the packet, the packet will be bypassed past all countermeasures specified in all filters applicable to the packet.
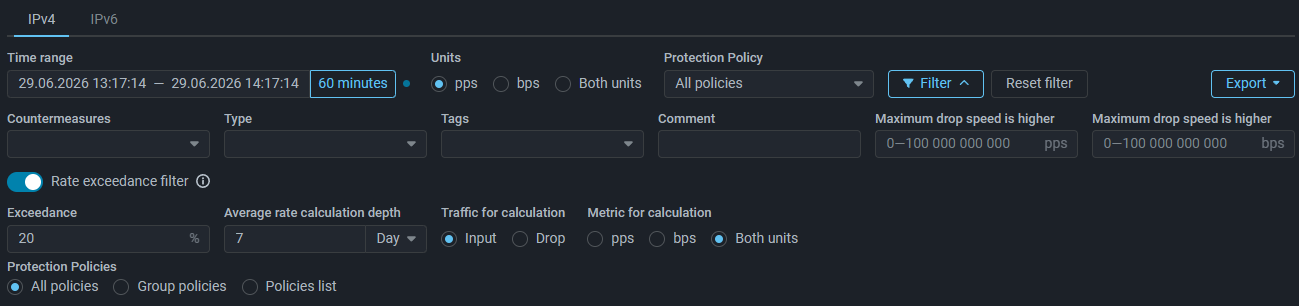
Added the ability to select all incidents within a specified period where the maximum incoming or dropped traffic rate exceeds the average maximum rate for all incidents that occurred during a time period set back from the end of the period by the calculation depth.
Changes in v26.04
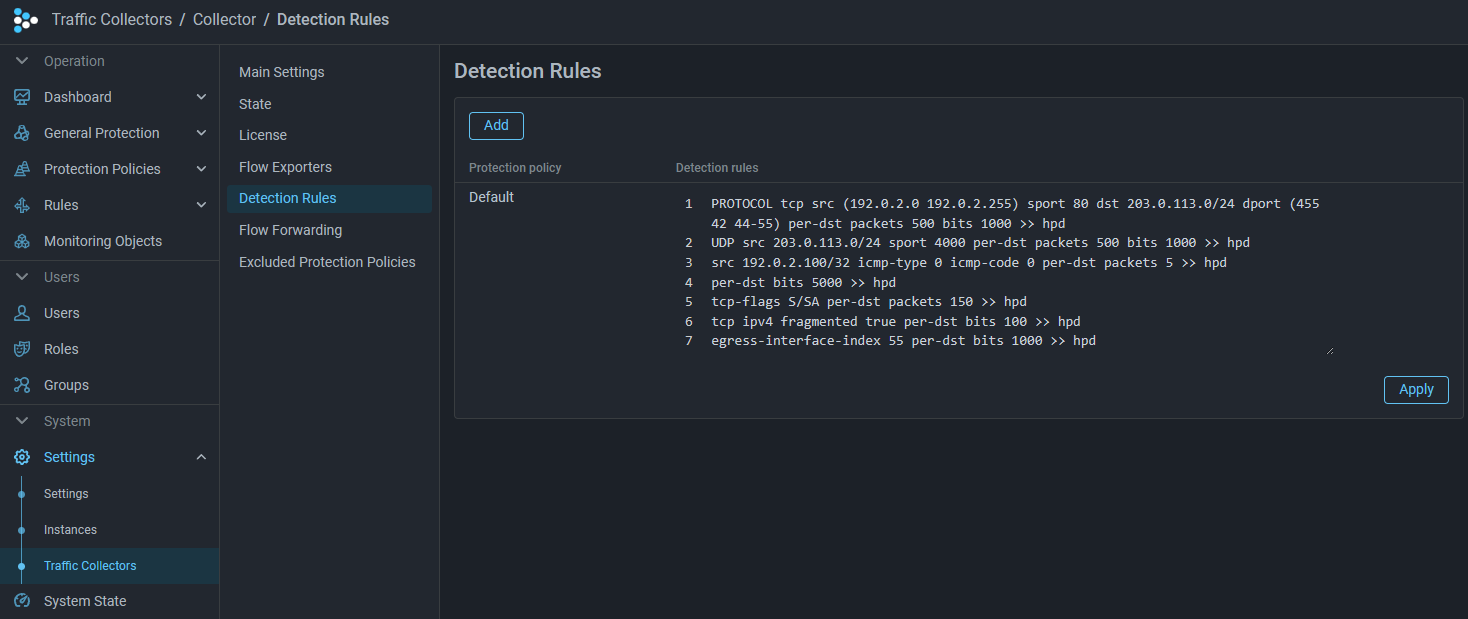
Now the Host Protection Detector can mark traffic to IP addresses for which a threshold exceedance has been detected on the Collector. To enable this, set the flag “Use collector detection based activation” in the HPD panel and configure traffic collection rules on the “Detection Rules” page.
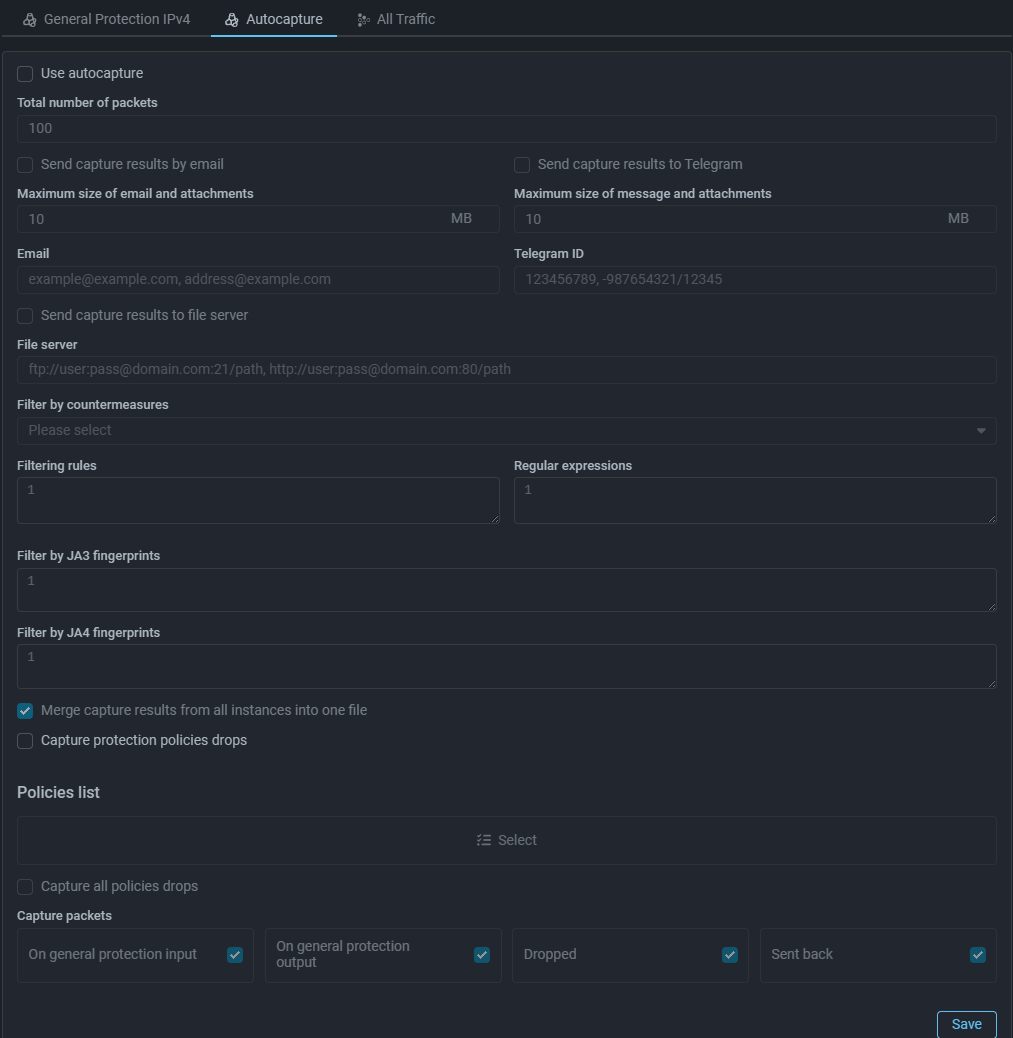
Automatic packet capture has been added to General Protection IPv4 and IPv6, similar to auto-capture in protection policies.
Now on protection policy graphs you can see curves for traffic from internal network, associated with this policy.
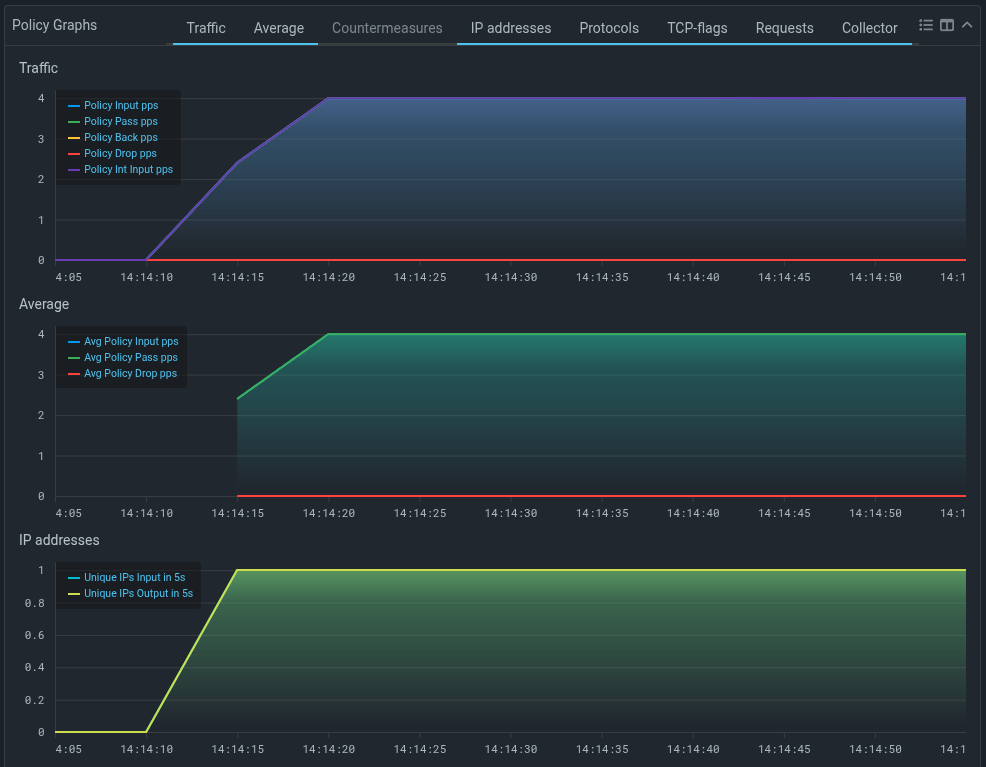
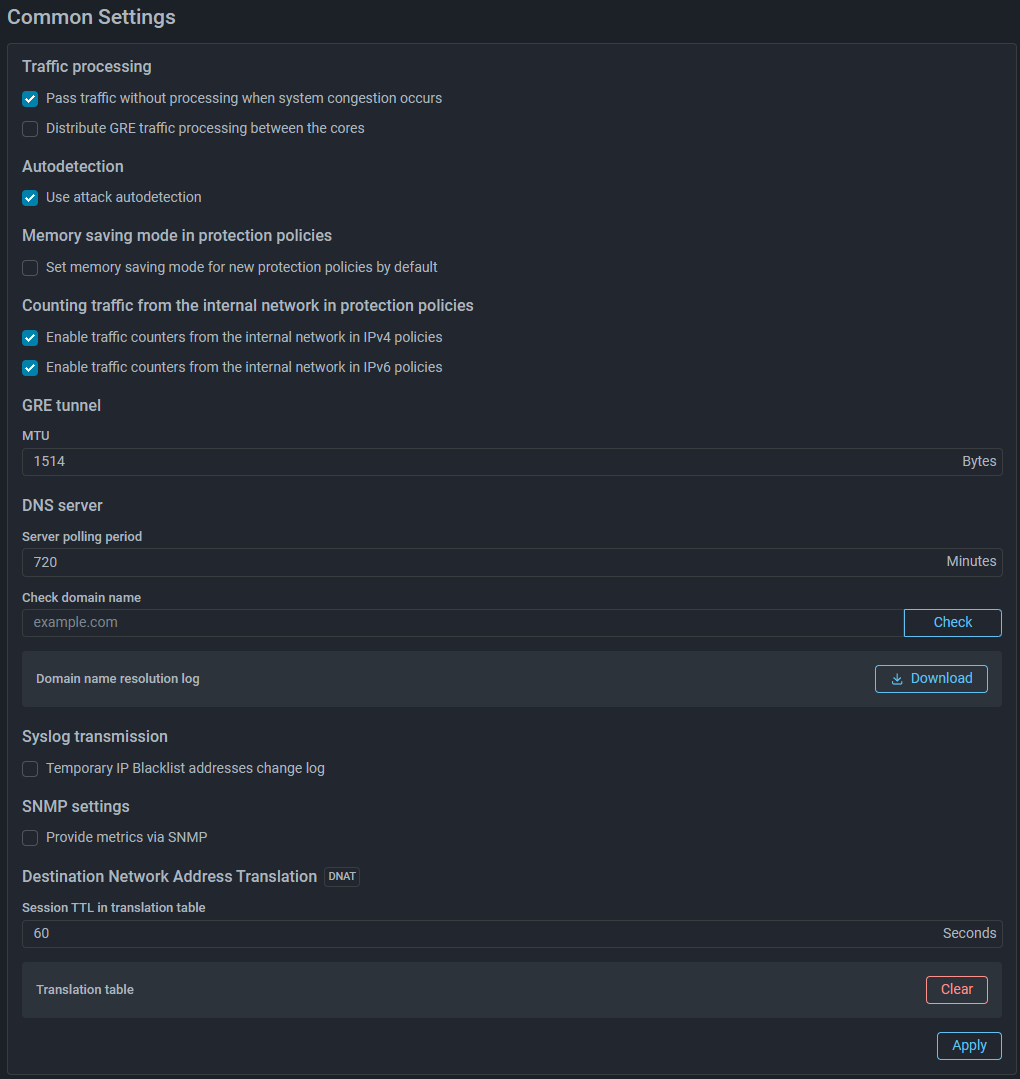
Enabling counting of traffic from internal network for display on graphs is done on the “Common Settings” page in system settings and affects all protection policies.
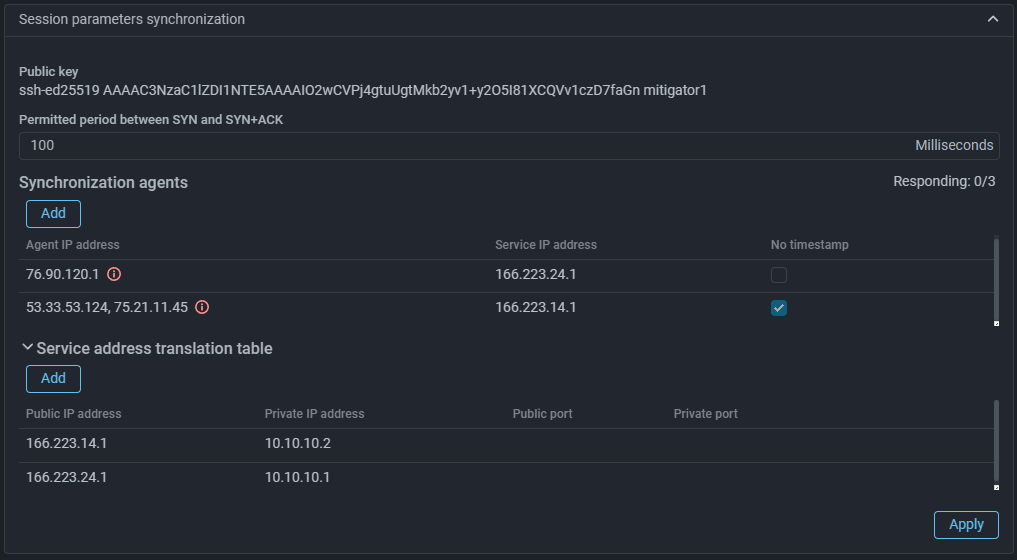
Now when checking SYN+ACK packets, you can select processing mode without taking Timestamp into account.
Since not all servers send Timestamp, the check can be disabled by setting the flag “No timestamp” in the session parameter synchronization settings for a specific server. The parameter applies to all servers listed in the line. If you need to apply it to only one server, you need to move it to a separate entry. If the synchronization agent is used in multiple protection policies, and in at least one of them the “No timestamp” parameter is set, it will be applied in all policies.
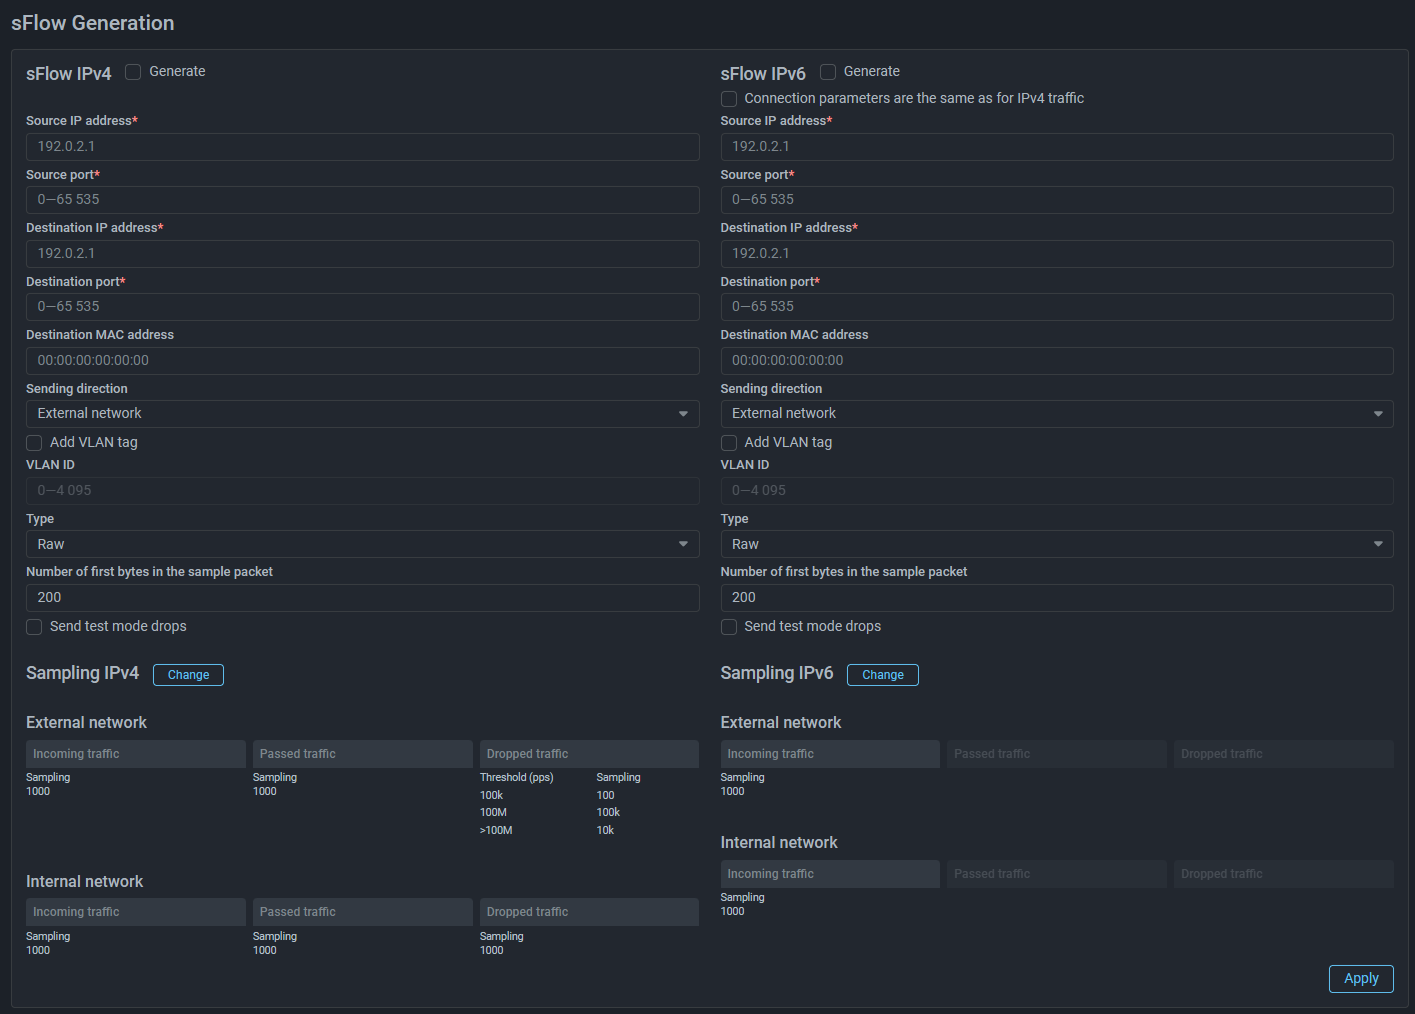
Now you can set different sFlow sampling values for different traffic rates. When the set rate threshold is exceeded, the sampling value changes automatically. You can set up to four sampling values for different traffic rate ranges.
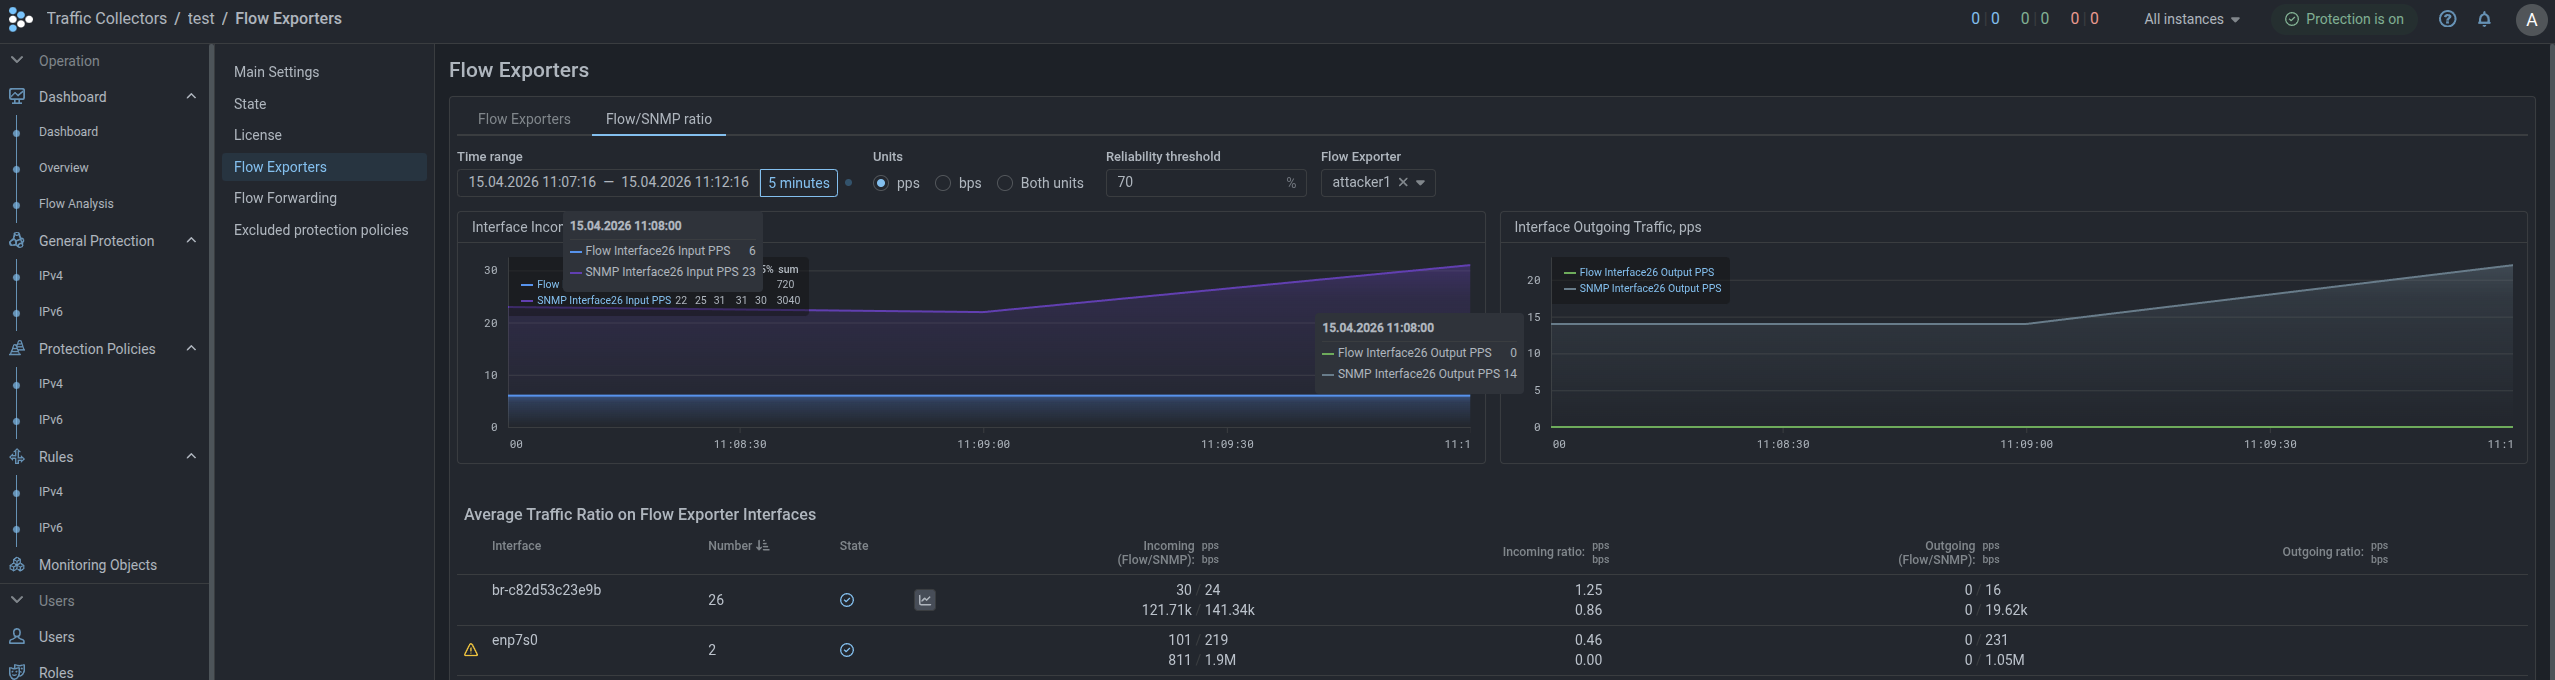
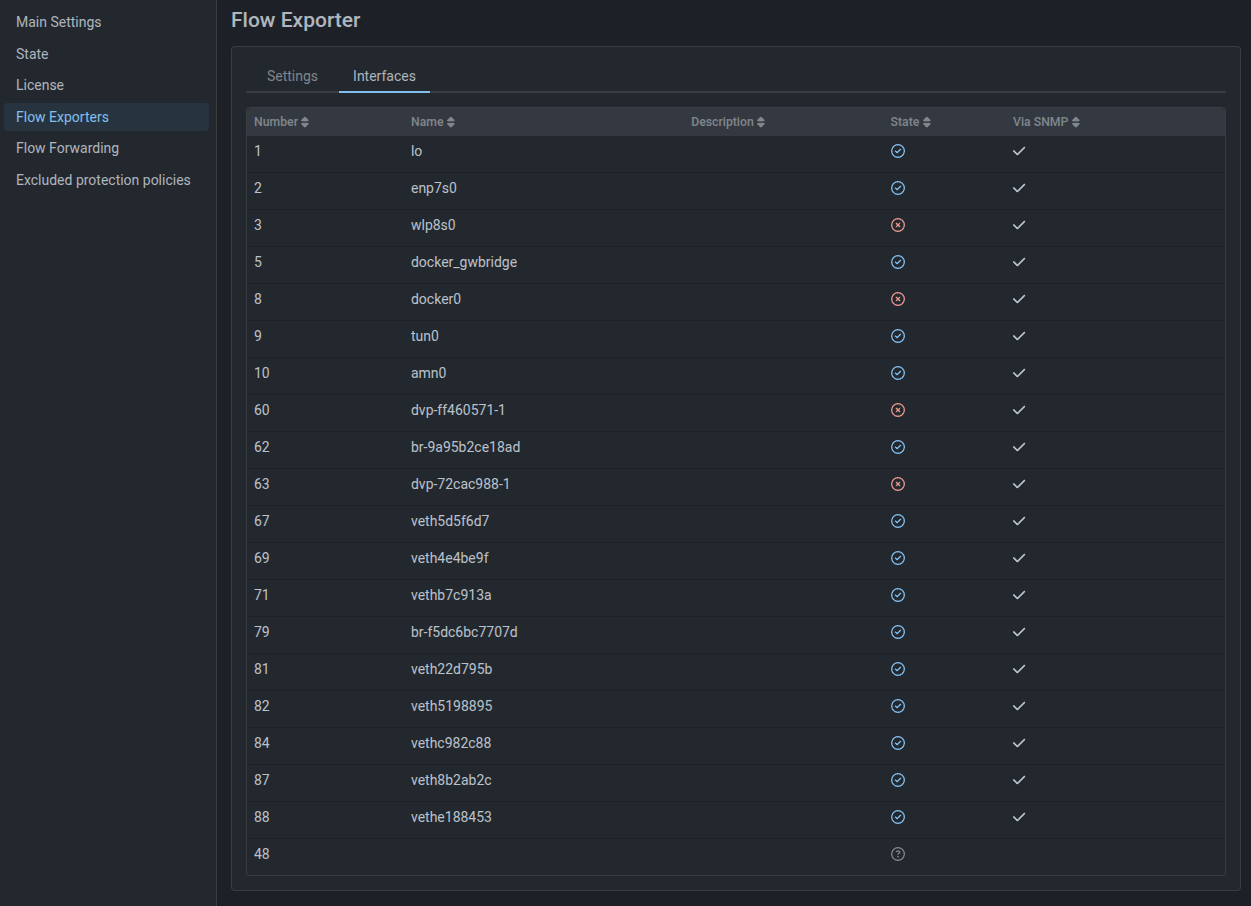
A “Flow/SNMP Ratio” tab has been added to the “Flow Exporters” page, displaying traffic statistics on all source interfaces obtained via Flow and SNMP.
The tab also specifies the “Allowable deviation”, which determines how much the ratio of the average traffic rate obtained via Flow to that obtained via SNMP can deviate from one. For example, with a tolerance of 10%, a ratio between 0.9 and 1.1 is considered normal.
If the deviation in the ratio of average traffic rate values received via Flow to those received via SNMP exceeds the acceptable limit, this may indicate that the system is configured incorrectly or that data is not being received. For such interfaces, appropriate indication appears in the row.
When activating the “GRE Tunnel with External Service” function in instance settings, GRE traffic processing is by default performed on a single CPU core. If the flag is set, balancing across all cores will be performed. The setting is applicable only when using Mellanox network cards, for other network cards the setting is ignored.
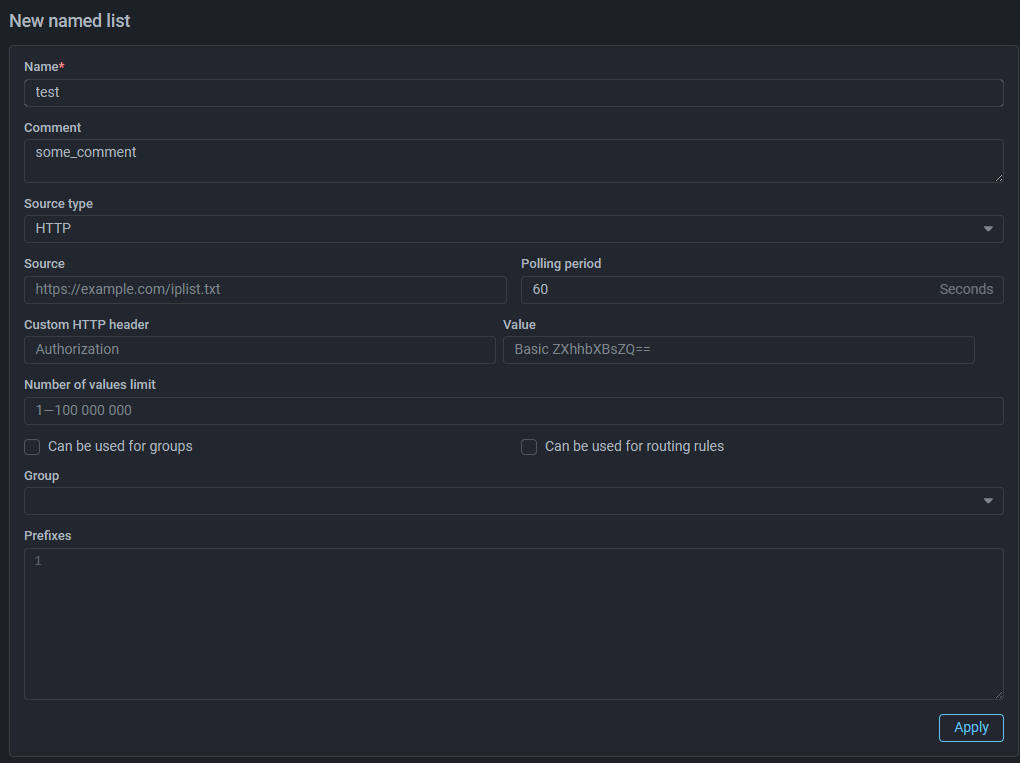
You can now specify custom HTTP headers and their values in named list parameters, for example, for authentication when fetching data from an HTTP-type source.
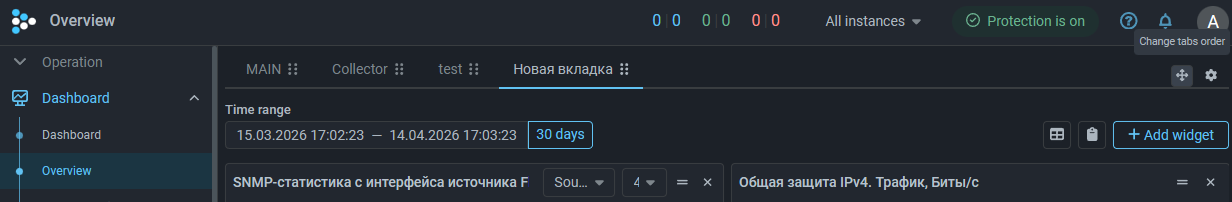
Previously tabs were sorted alphabetically, now by clicking the “Change tab order” button, you can move tabs.