Version v23.12
v23.12 added mechanisms for data synchronization between MITIGATOR instances,
added a new MSSB countermeasure, syslog sending on dropped packets and
new auto-detection thresholds.
Enhanced functionality of countermeasures SPLI, NCL, DNS, HCA, WAFR
and also Collector and Logan.
Follow the special instructions to update MITIGATOR to v23.12 version.
Changes in v23.12.3
MSSB. Added countermeasure to counteract distributed attacks to the IPv4 General Protection.
Syslog. Added the ability to specify the destination MAC address in the parameters for sending syslog with information about drops.
Collector. Added statistics output in tabular and graphical form for the TOP values of the PEN field.
Now on the Flow Analysis page and on the Flow Analysis tab in the protection policy you can get statistics on the top values of the PEN field.
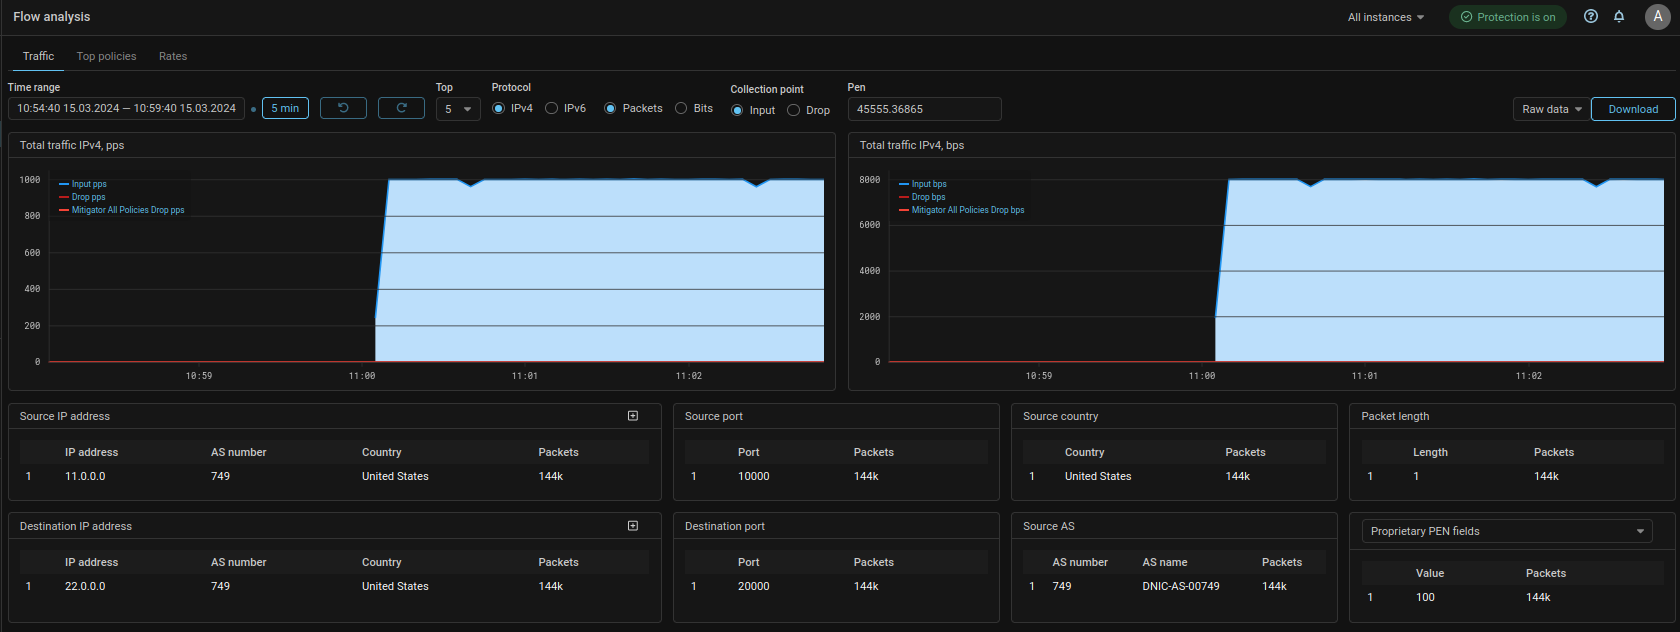
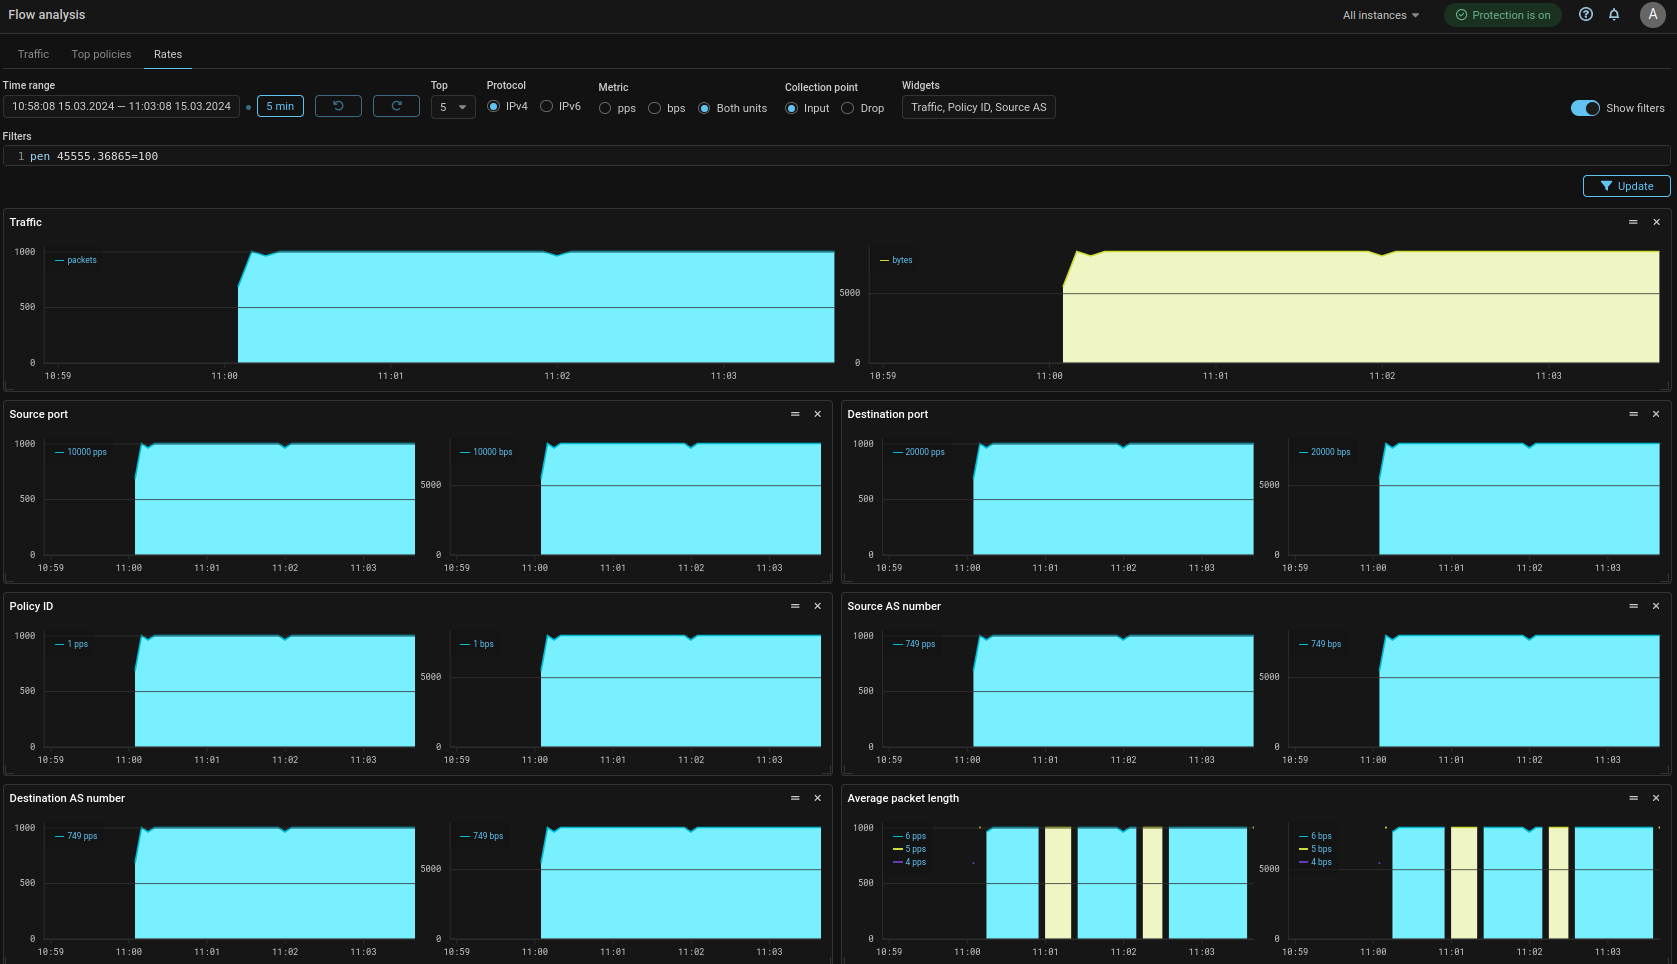
Also added the ability to filter by the value of the PEN field to the Rates tab.
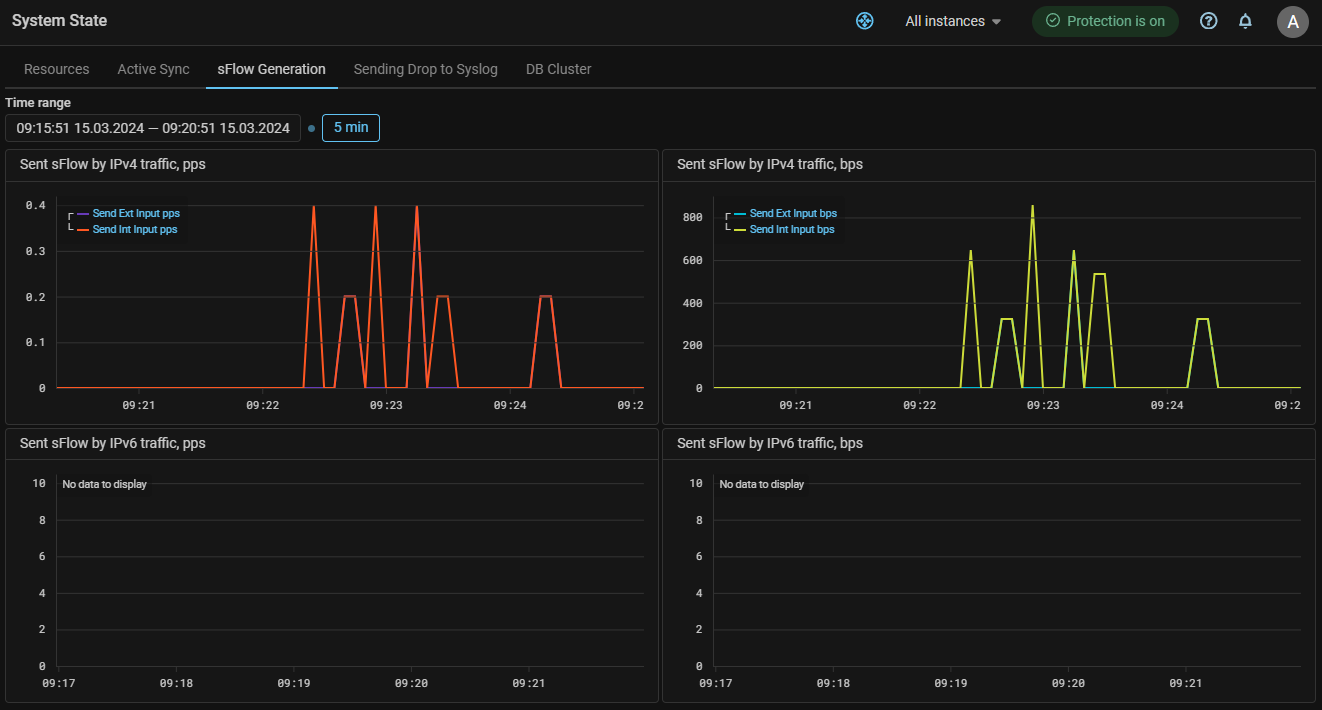
UX. Added graphs of traffic generated when sending sFlow.
Changes in v23.12
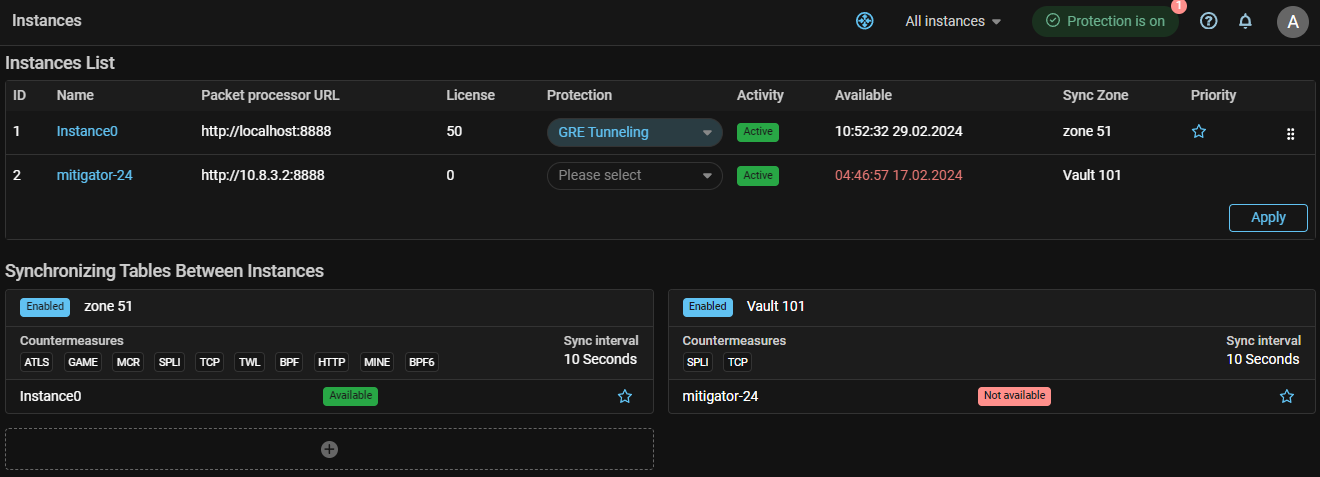
Sync. Added active-standby synchronization.
A cluster can be divided into several synchronization zones. The synchronization zone includes the selected packet processors. The data is synchronized between of them.
Synchronization within a zone is controlled by the synchronization master. The master and the sequence of successors are set in the zone settings. Synchronization for each zone is performed independently.
Synchronization is applicable for TBL, TWL, MCR, TCP, MINE, HTTP, ATLS, GAME, SPLI and BPF countermeasures. A set of countermeasures is specified in the zone settings.
The interaction occurs through the control-plane inside the VPN.
Application:
Let’s say the traffic of the protected resource passes through the DC_2, and DC_1 is the backup one.
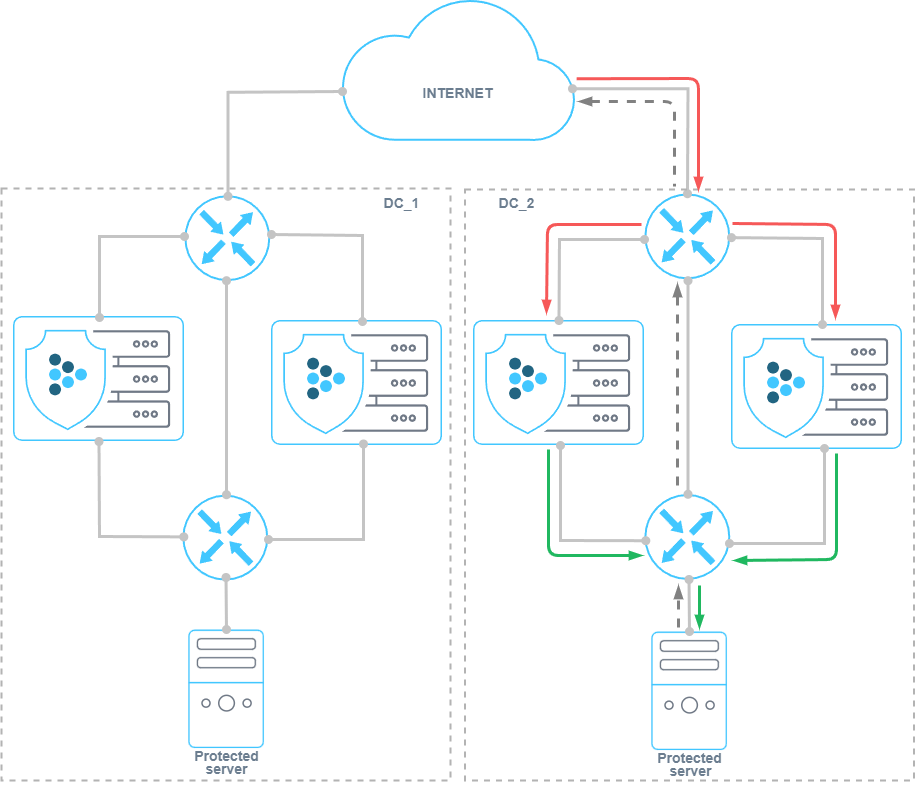
-
When traffic is switched to DC_1, and if countermeasures are active, previously established connections may be dropped because the MITIGATOR countermeasures on DC_1 do not have information about authenticated IP addresses.
If active-standby synchronization is enabled, data from DC_2 tables will be periodically transferred to DC_1. This will avoid connections breaks.
TBL countermeasure block list data is similarly synchronized, allowing traffic to continue to be blocked when traffic switches to other packet processors.
-
In the case when the traffic of one service goes through DC_1, and another goes through DC_2, synchronization will help to maintain the ability to transfer traffic of any service to a neighboring DC without breaking sessions.
-
In the case when the traffic within a single DC is distributed to several packet processors, synchronization will help to avoid connections breaking and attack traffic pass if traffic switched to another processor, for example, in case of processor shutdown.
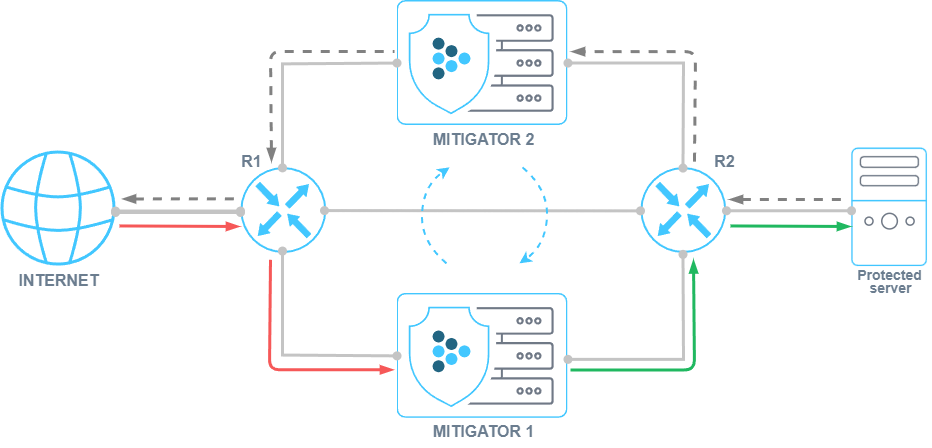
Active Sync. Added active-active synchronization.
For cases where the countermeasure operation is sensitive to data synchronization delays between packet processors, an active synchronization mechanism using the BMDP (BIFIT MITIGATOR Distributed Processing) protocol added. The protocol works over UDP and allows instances of MITIGATOR to exchange BMDP messages via data interfaces with minimal latency.
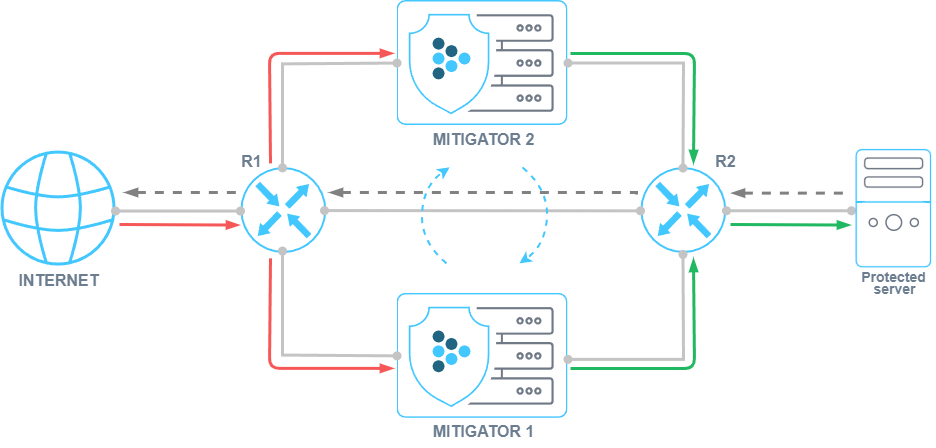
This type of synchronization differs from active-standby synchronization in terms of requirements for the implementation scheme, system resources and network load. However, both synchronizations can operate simultaneously and independently.
MSSB. Added countermeasure to counteract distributed attacks to the IPv4 Protection Policy.
SPLI. Added support for working in a cluster with traffic asymmetry.
The SPLI countermeasure is the only countermeasure in MITIGATOR that requires symmetry for traffic. However, if active-standby and active-active synchronization are enabled, it is possible to organize the operation of SPLI during traffic asymmetry, when client traffic arrives at one instance, and response packets from the server come to another.
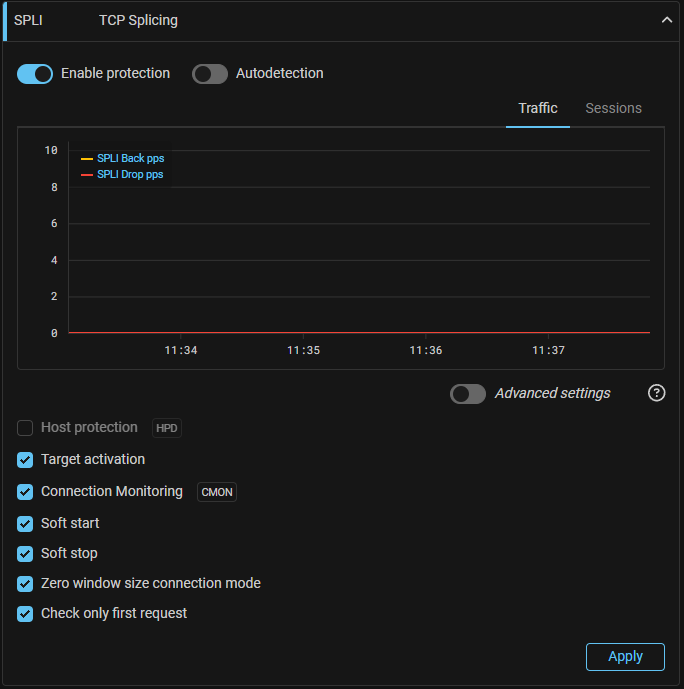
SPLI. Added support for Host Protection Activation.
Now SPLI, similar to TCP, can activate protection only for destination IPs for which the rate of TCP segments with certain flags is exceeded.
SPLI. Added the "Connection Monitoring" function usage.
Now, when enabled, SPLI may not drop traffic from sessions established before the countermeasure was enabled.
SPLI. Added the "Soft Stop".
When the countermeasure is disabled, previously established sessions will be broken because the client and server will have inconsistent sequence numbers. Just as Soft Start helps prevent sessions from being broke when a countermeasure is enabled, Soft Stop mode prevents sessions from being broke when disabled.
NCL. Added the "Soft Start".
DNS. Added a validator option for TCP segments containing multiple DNS queries.
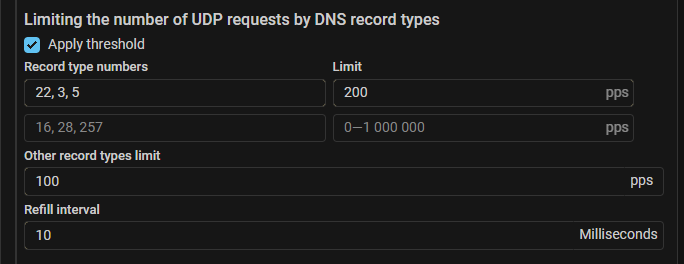
DNS. Added limitation on the UDP requests number by DNS record type.
Added the ability to set a limit on the maximum number of UDP requests with certain numbers of DNS record types per second. Many restrictions can be set. Each restriction can specify multiple record types.
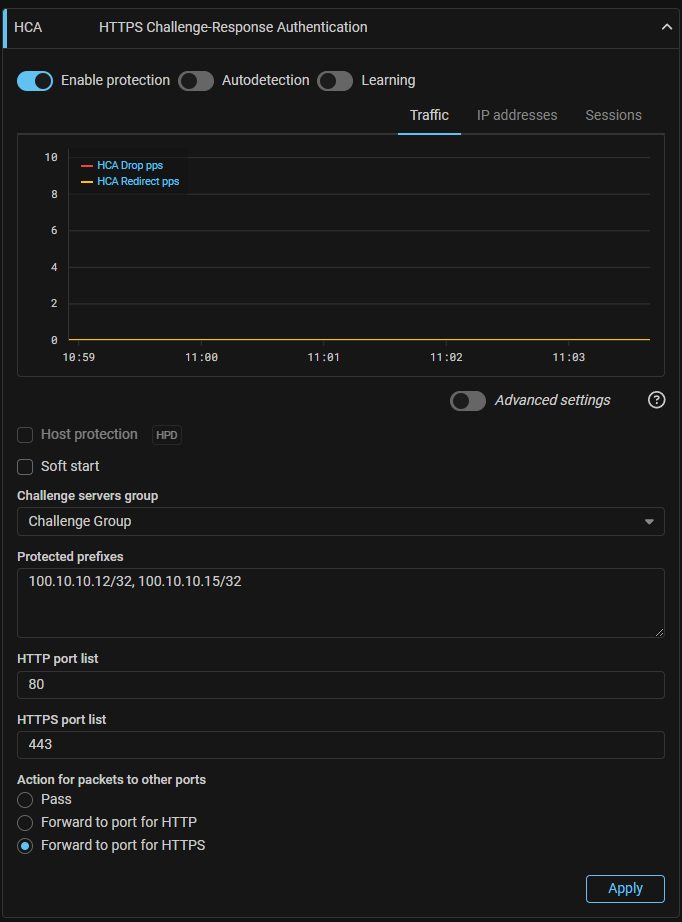
HCA. Changed the principle of Web-challenger specifying for the package processor.
After updating to v23.12, previously configured Web-challenger settings are not saved. Remake the settings in the “HTTPS Challenge-Response Authentication” panel at the “Settings” page.
Now, to integrate with Web-challenger, each dataplane must be associated with its own Web-challenger.
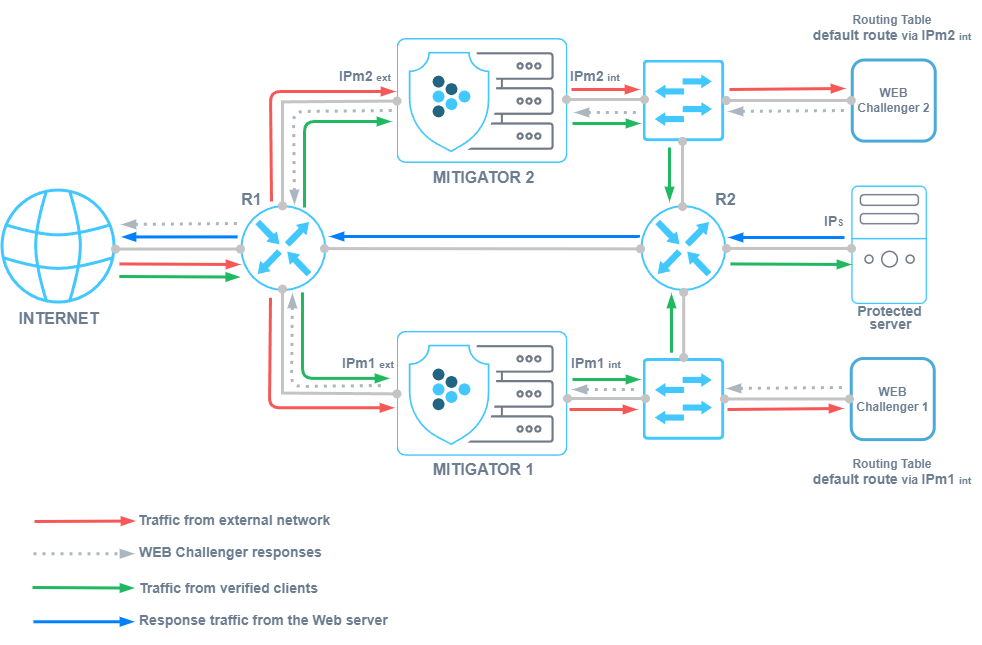
To do this, in the system settings you need to create a group of challenge servers and set the correspondence between all available data-planes and specific Web-challengers.
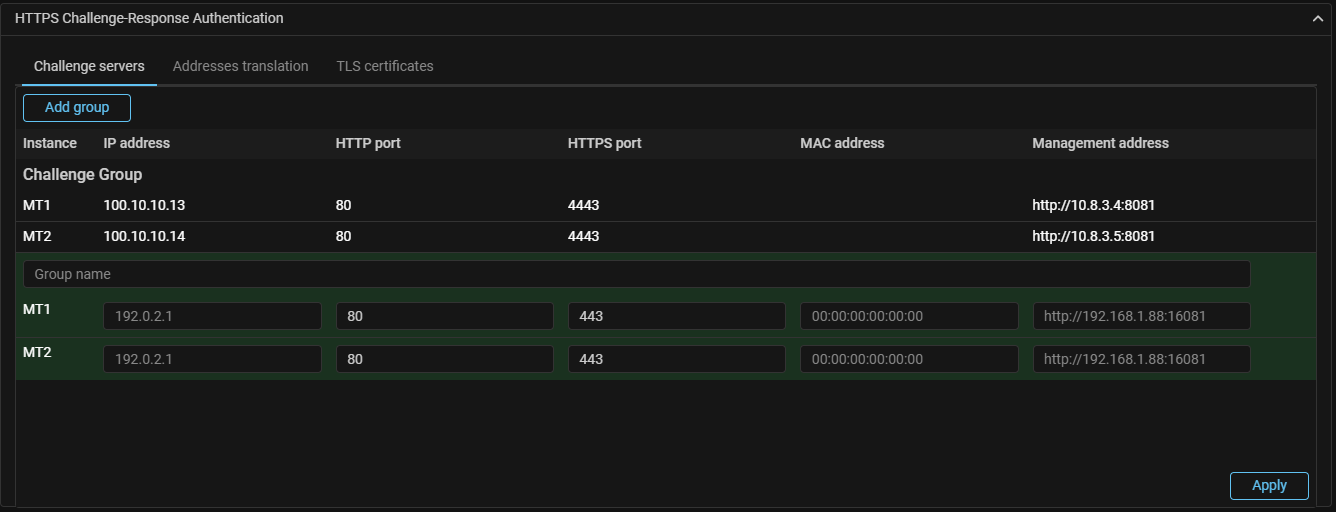
The HCA countermeasure settings now specify a group of challenge servers.
HCA. Added support for HTTP traffic.
For the HTTP traffic processing scenario, the ability to specify separate ports for HTTP and HTTPS traffic added to the challenge server. Requests to the specified port numbers will be forwarded by the HCA countermeasure to the corresponding Web-challenger ports.
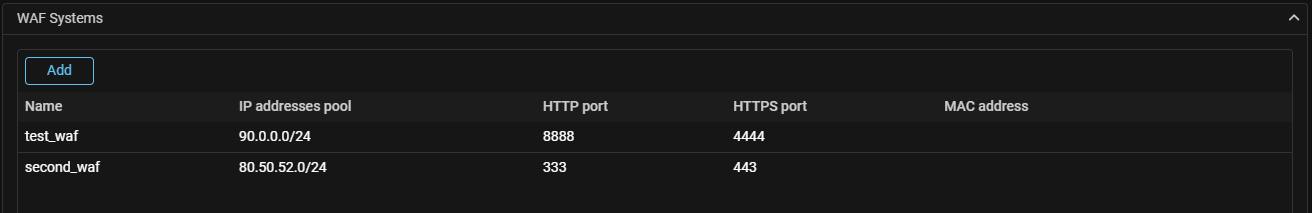
WAFR. Added simultaneous redirection of HTTP and HTTPS traffic.
To redirect traffic from two protocols at once, the ability to specify separate ports for HTTP and HTTPS added.
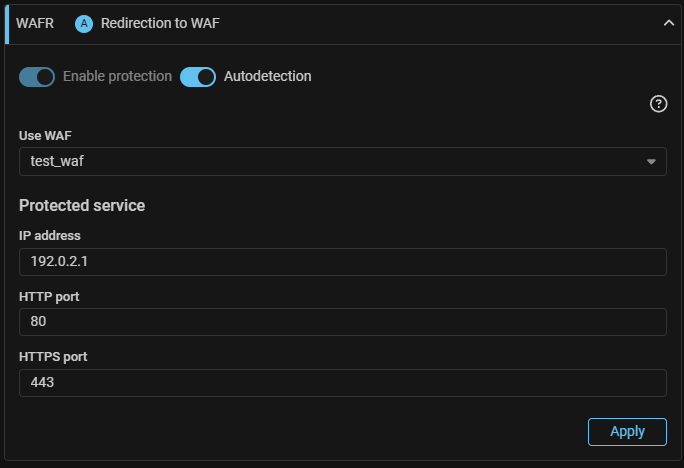
Traffic to the specified port numbers will be redirected by the WAFR element to the WAF ports specified in the system settings.
Detect. Added autodetection thresholds based on the number of TCP flags for VAL and SPLI.
Added thresholds:
SPLI.{Syn,SynAck,Ack,Rst,RstAck,Fin}Pps.{On,Off,Diff};SPLI.AckBps.{On,Off,Diff};VAL.{Syn,SynAck,Ack,Rst,RstAck,Fin}Pps.Diff;VAL.AckBps.Diff.
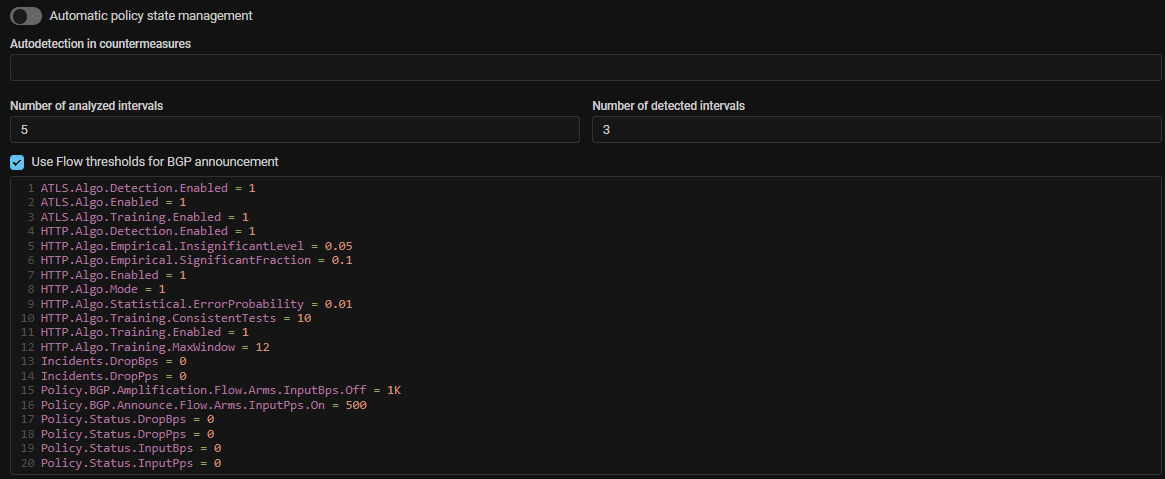
Detect. Added disabling of autodetection thresholds to control BGP advertising based on collector data.
Now any thresholds whose name contains .BGP.*.Flow. work only if the
“Use Flow thresholds for BGP announcement” checkbox is set.
It allows to disable advertising based on collector data if necessary,
without removing the thresholds.
sFlow. Added traffic accounting from the internal network.
Now, when generating sFlow for incoming and dropped traffic, traffic coming from the internal network is taken into account.
Syslog. Added syslog sending on dropped packets.
Now each MITIGATOR instance can send information about dropped packets via syslog (RFC5424).
Sending parameters for each instance are set separately.
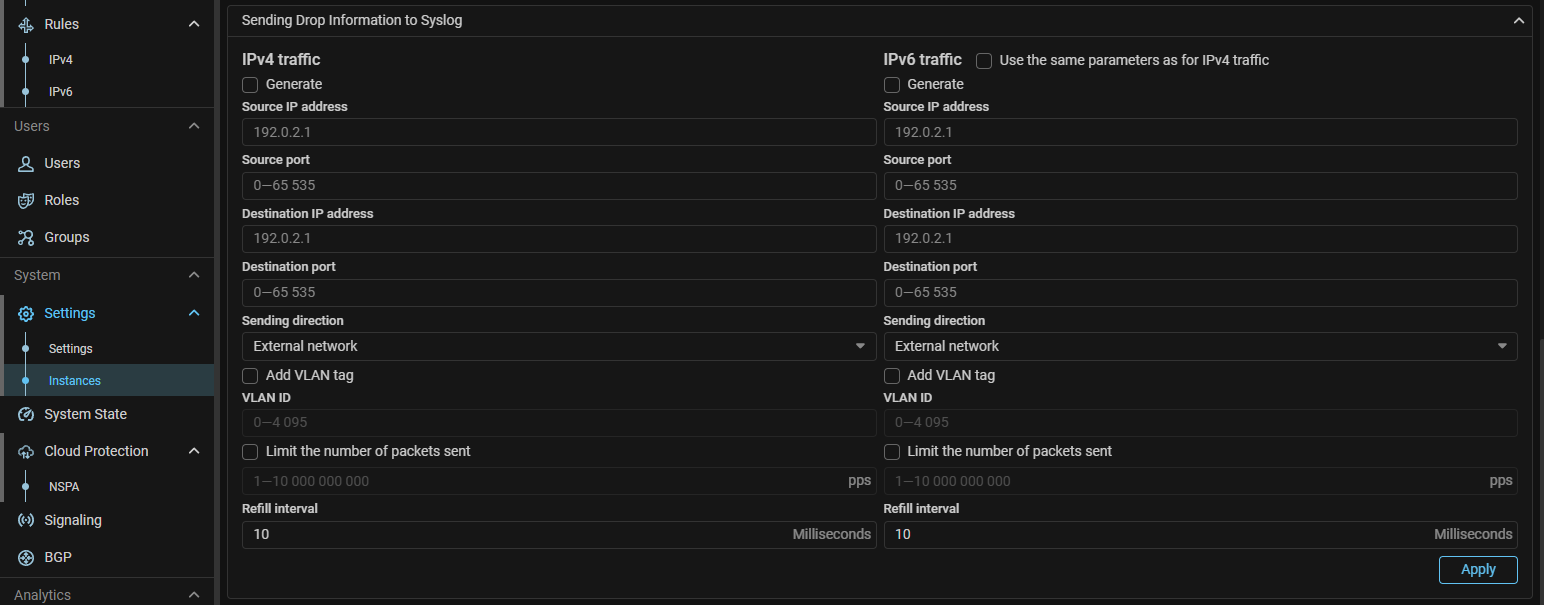
The message contains information about the date and time, protocol, source and destination IP addresses and ports, countermeasures and policies in which the drops occurred and other data.
Format:
<PRIORITY>VERSION TIMESTAMP HOSTNAME APP-NAME PROCID MSGID STRUCTURED-DATA PROTO SRC_IP SRC_PORT DST_IP DST_PORT ELEMENT POLICY ZONE INSTANCE PACKETS BYTESExplanations:
- PRIORITY — always “<14>” Facility: user-level messages, Severity: informational;
- VERSION — format version, always “1”;
- TIMESTAMP — dataplane local time;
- HOSTNAME — message source IP;
- APP-NAME — always “mitigator”;
- PROCID — not used, indicated “-”;
- MSGID — differ in IP protocol version, “4” or “6”;
- STRUCTURED-DATA — not used, indicated “-”;
- PROTO — protocol number;
- SRC_IP — source IP;
- SRC_PORT — source port;
- DST_IP — destination IP;
- DST_PORT — destination port;
- ELEMENT — countermeasure short name;
- POLICY — protection policy number (“G” for general protection);
- ZONE — packet came from: “0” - external network, “1” - internal network;
- INSTANCE — MITIGATOR Instance ID;
- PACKETS — number of dropped packets;
- BYTES — number of dropped bytes.
Example:
<14>1 2023-09-27T10:49:30Z 1.1.1.1 mitigator - 4 - 6 2.2.2.2 1000 3.3.3.3 433 ACL G 0 7 1 54Core. The old configuration file format is no longer supported.
The data-plane.conf format that existed before v20.08 is no longer supported.
Most operators will not be affected by this change, however,
if version 20.08 or earlier is used, make sure that the settings are
set correctly.
Core. The configuration file renamed.
The file data-plane.conf has been renamed to dataplane.conf.
Compatibility with the old name is preserved.
Core. Changed the packet processor container name.
The name of the data-plane container in the .yml files changed
to dataplane.
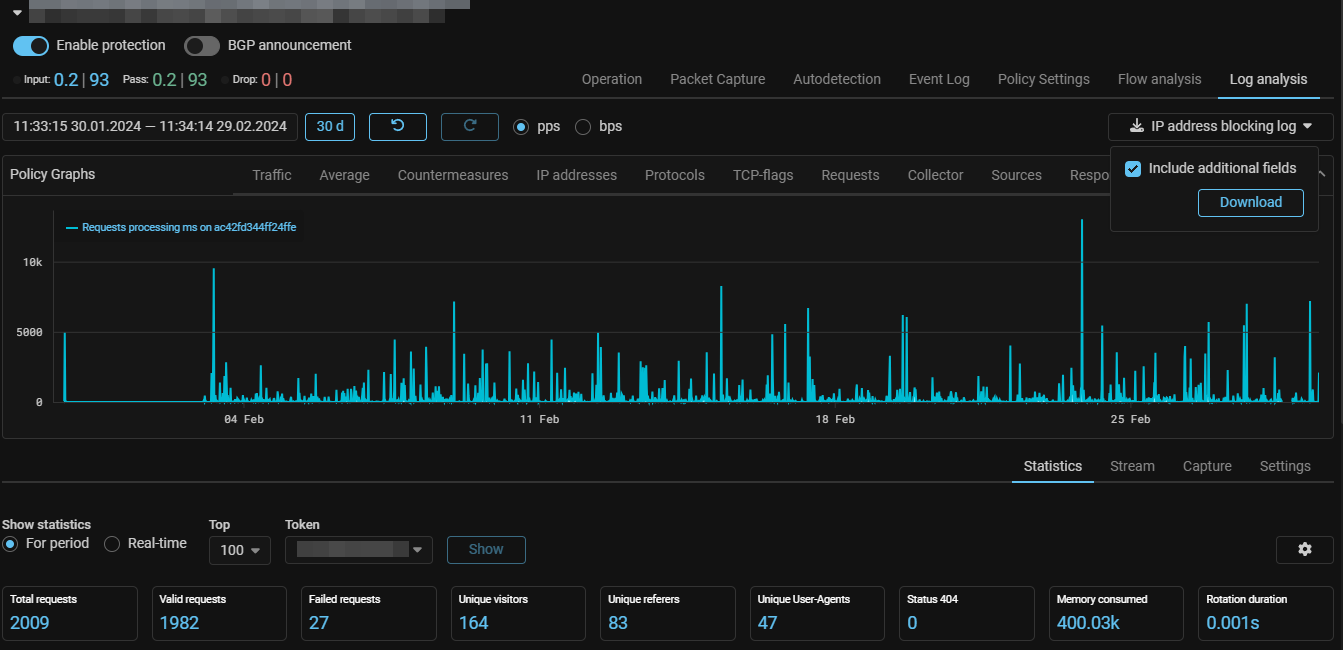
LOGAN. Added an IP address blocking log.
Now, on the “Log Analysis” tab, you can download the IP address blocking log with a block reason indication.
LOGAN. Added an own autodetection mechanism.
The keyword detect has been added, allows to set a threshold, after exceeding
which the rest of the set of rules is activated.
For example, when specified:
detect dst.rps.on limit 100 period 10
block 600 user-agent axios|Python|fasthttp
the blocking of the IP address by the value of the user-agent in its requests will occur only if the protected web server receives more than 100 requests in 10 seconds.
LOGAN. Added wildcard support for metrics based on response codes.
The rules for the response codes of the web server now accept the wildcard entry.
For example, the following rule means, that an entry will be created in the event log if the web server responds 100 times in 10 seconds with codes 400-499:
alert dst.4xx limit 100 period 10LOGAN. Added the ability to set any response code in the rules.
Previously, the set of metrics for response codes was strictly defined, now you can specify any response code in the rule.
Example:
block src.401 limit 100 period 10
block src.404 limit 100 period 10
block src.422 limit 100 period 10
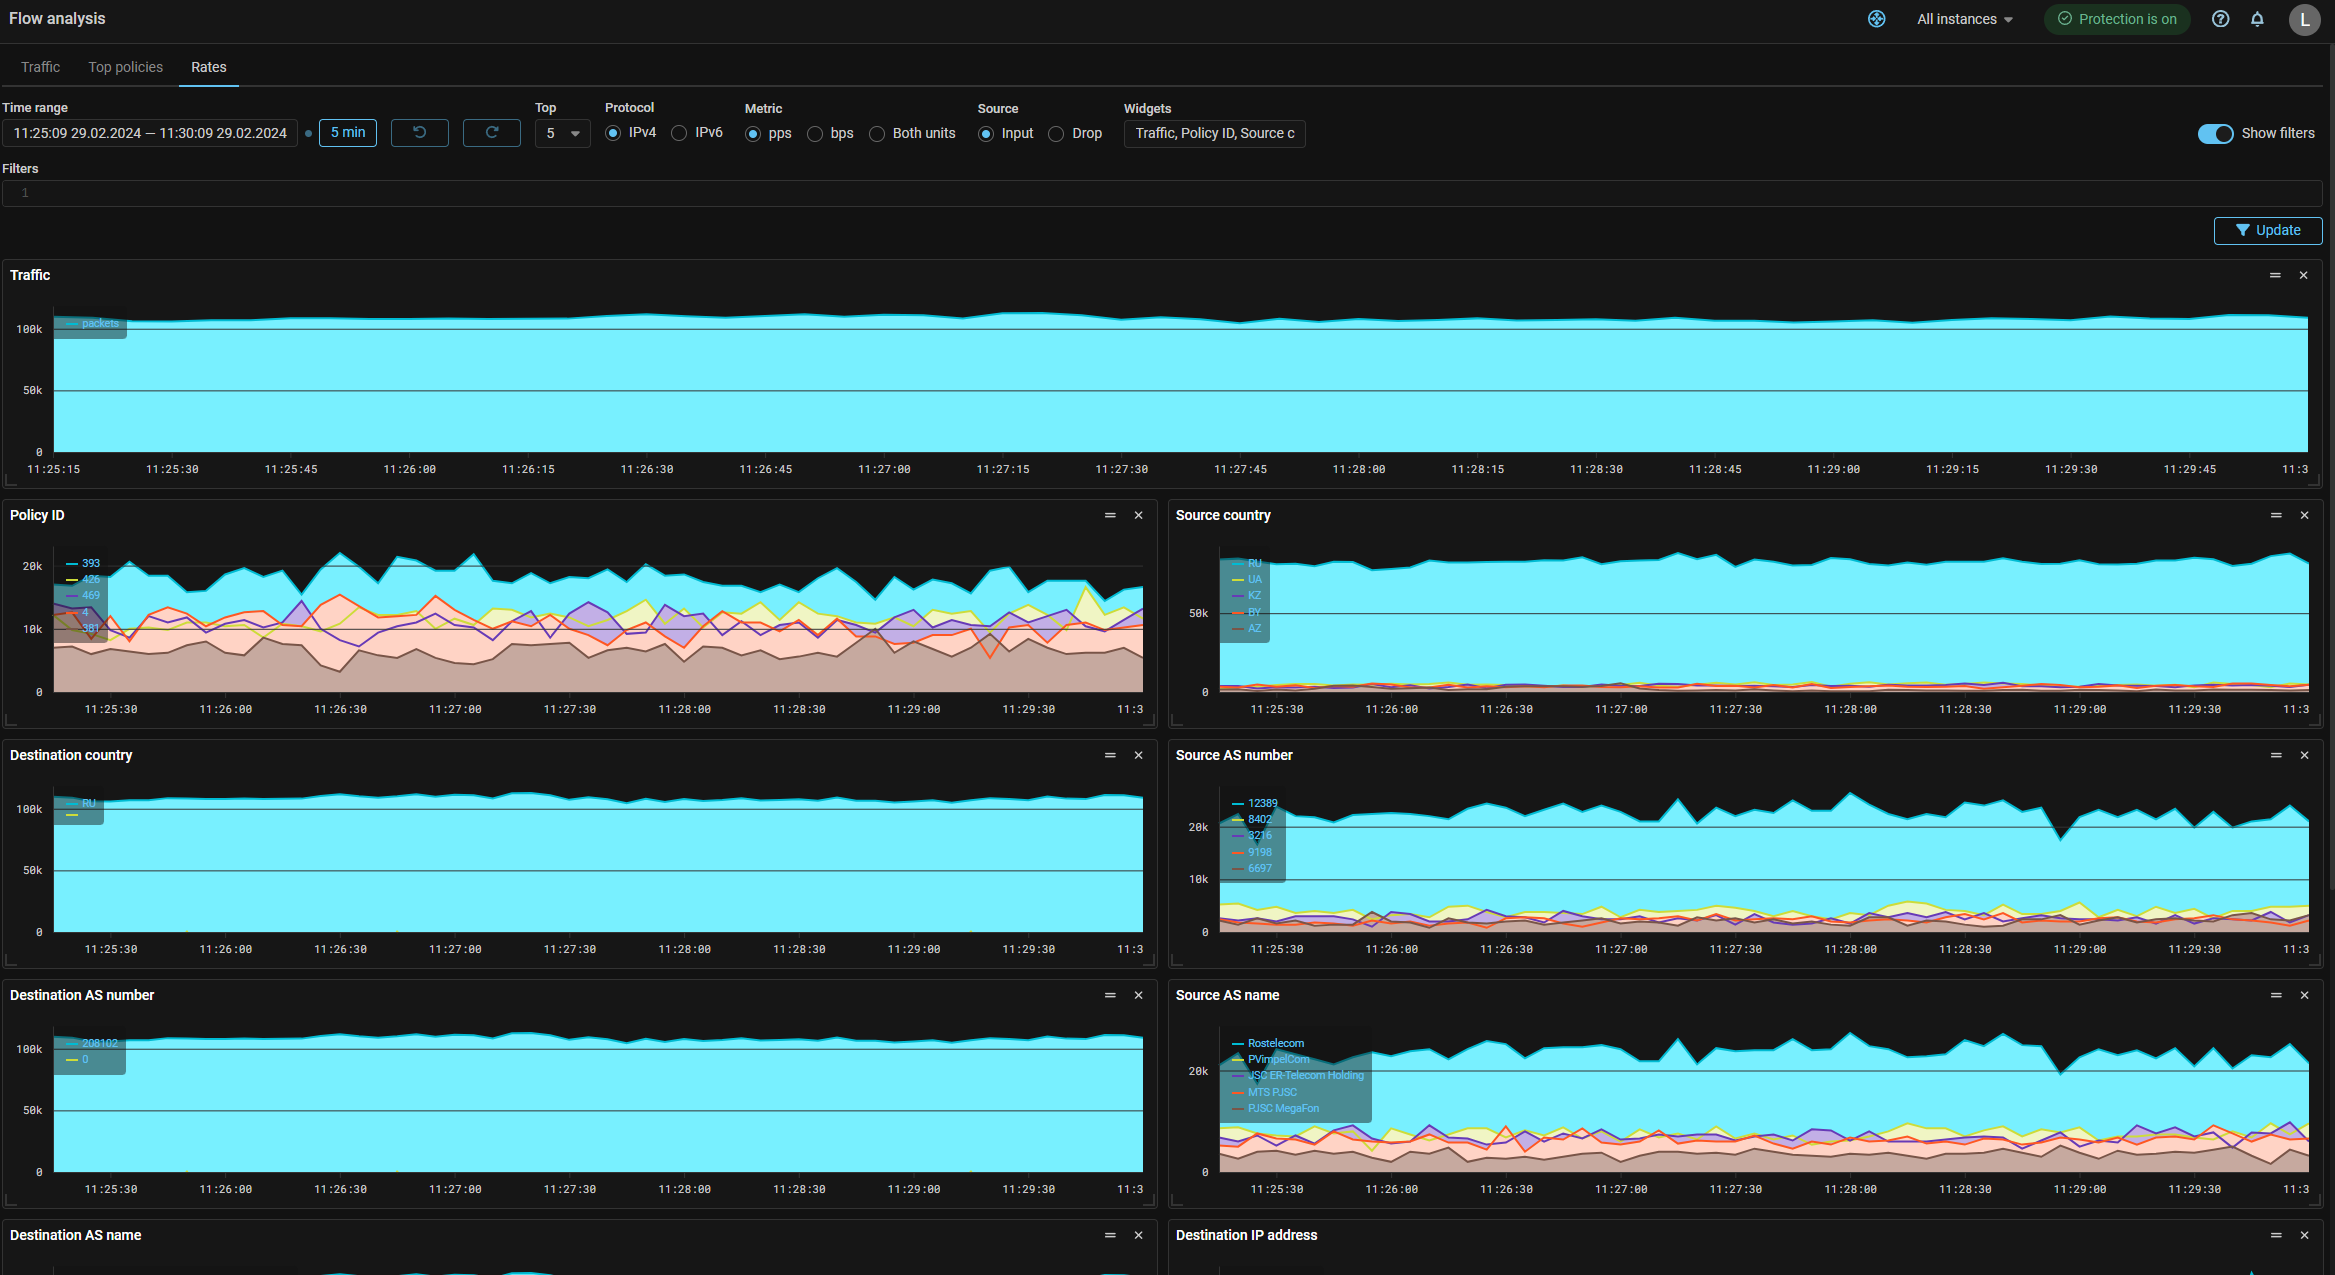
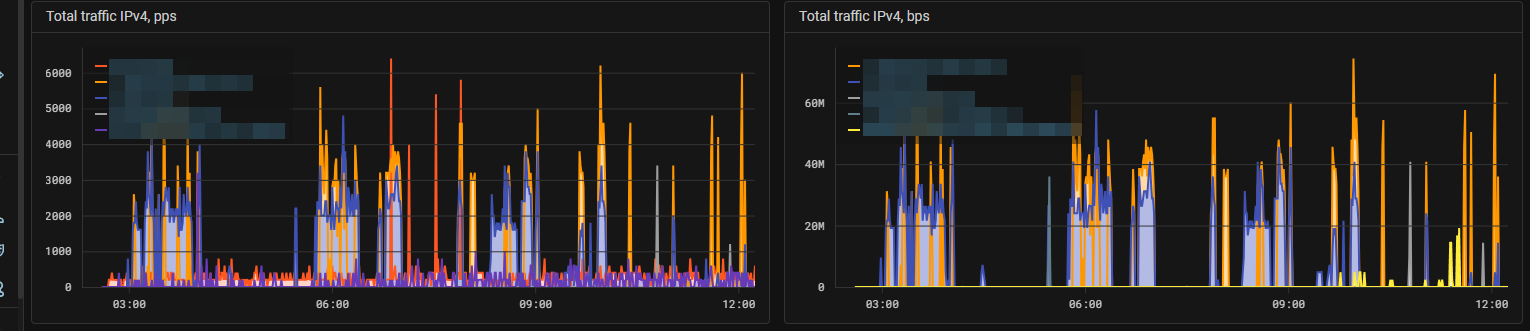
block src.499 limit 100 period 10Collector. Added a view of statistics from the collector by custom filters.
The “Rates” tab has been added to the “Flow Analysis” page, which displays data from the Collector in the form of graphs. The data is grouped by categories, the graphs for each category are displayed in separate widgets, for which the size and location on the page are configured. The display of each category is set by a flag. You can set a custom filter, in this case, only the data corresponding to the entered filter will be displayed on all graphs. There is a logical “And” between the lines. Thus, for example, you can plot the flow received from a specific source, or from a specific range of ports.
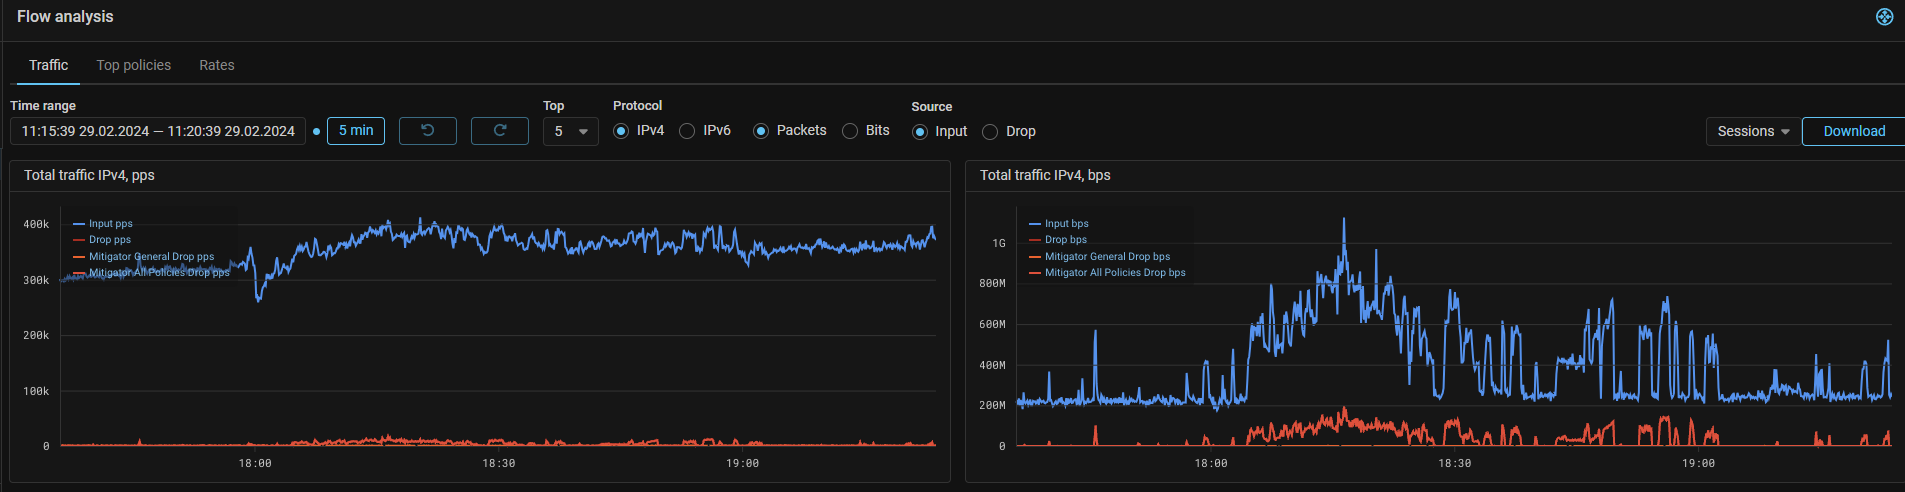
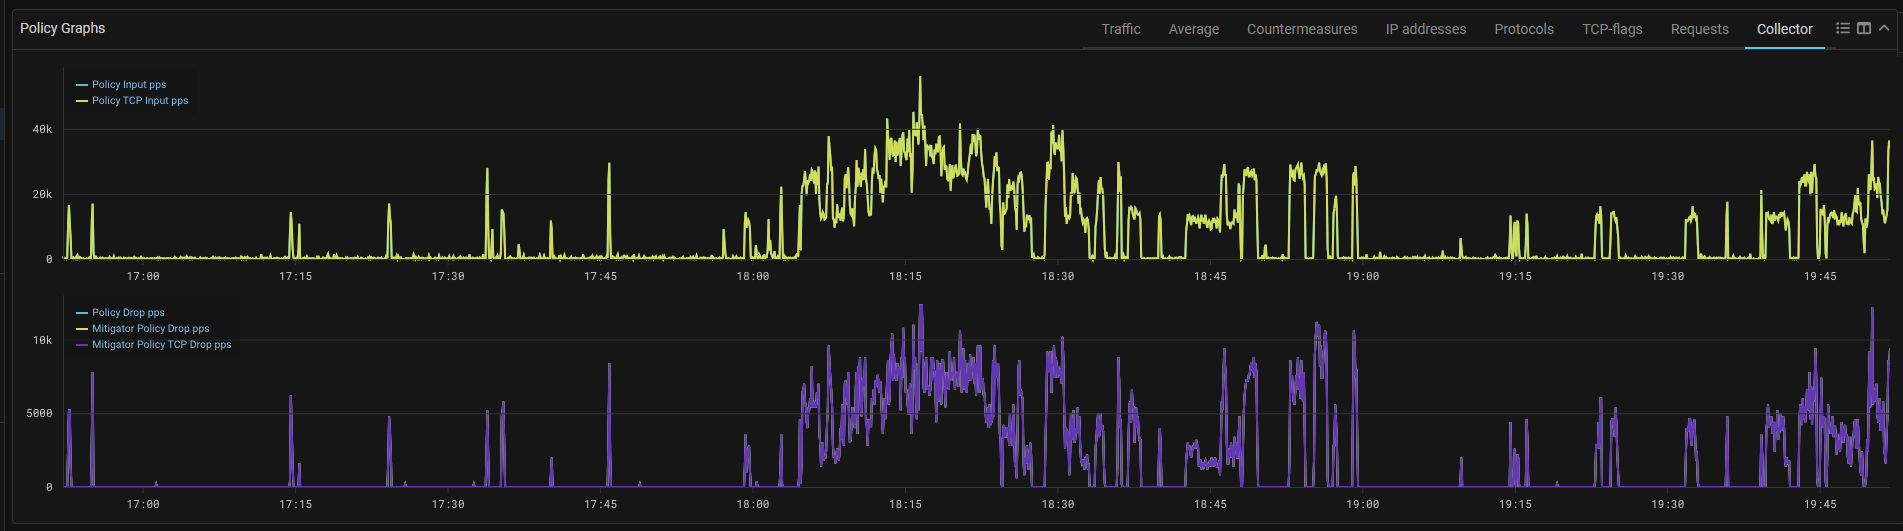
Collector. Added graphs of dropped traffic according to collector data.
Drop graphs added to the Policy Graphs and “Flow Analysis” page.
The graphs show traffic arriving at the collector marked as “dropped”, for example, when sending sFlow over dropped packets from MITIGATOR, or from other sources.
The graph shows traffic dropped by MITIGATOR countermeasures and traffic dropped by other systems as separate curves.
The curves of traffic dropped on MITIGATOR contain the word “Mitigator” in the name. Drops based on flow data from other sources are marked with the prefix “Other”. The “Drop” graph without prefixes in the name shows the total drop from all sources.
Similar graphs have been added to the “Top Policies” tab. Also, the Top IPv4 Policies and Top IPv6 Policies graphs display graphs of the total drop for the most loaded policies.
System. Added database cluster status monitoring.
A DB Cluster tab added to the System State page, which displays information about the status of the database cluster. For each database, its role is displayed for each MITIGATOR instance with pgfailover active.
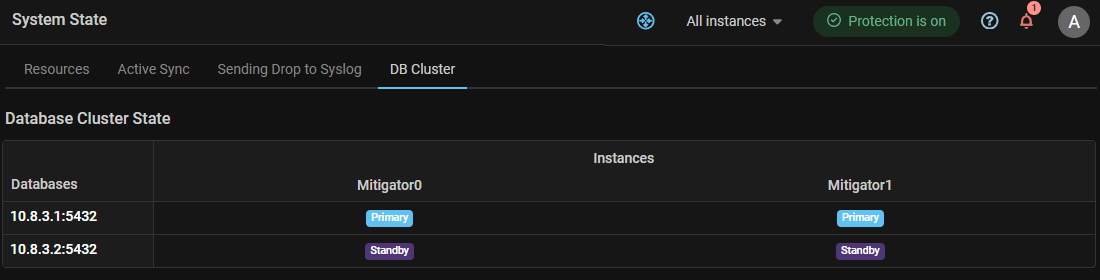
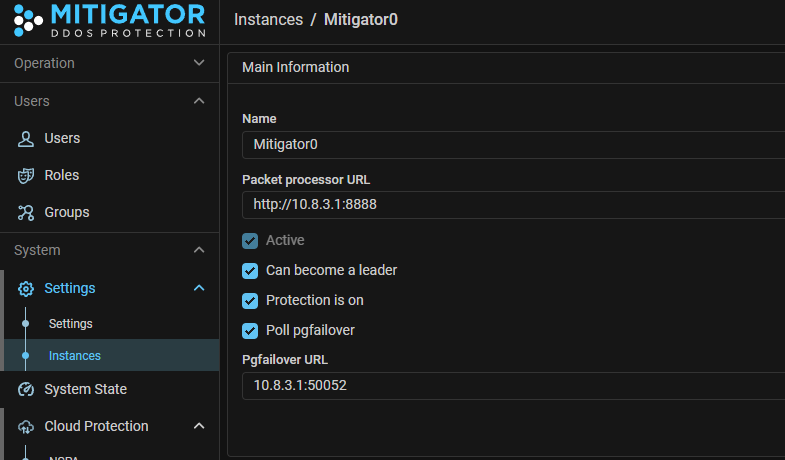
For statuses to work, you need to enable pgfailover polling in the instance settings.
The system event log, including those sent via syslog, now records events related to database monitoring:
| Event type service identifier | Event type name |
|---|---|
| pgfailover_sync | The database cluster has been restored |
| pgfailover_issue_detected | An issue has been detected with the database cluster. |
| pgfailover_connect | The connection to pgfailover established |
| pgfailover_disconnect | The connection to pgfailover lost |
| pgfailover_switch_enable | pgfailover polling enabled |
| pgfailover_switch_disable | pgfailover polling disabled |
The user can configure the distribution of notifications about these events by email, Telegram or through the “Vestochka” notification distribution service.
Also, if problems arise with database synchronization, a message about desynchronization will appear on the system message indicator.
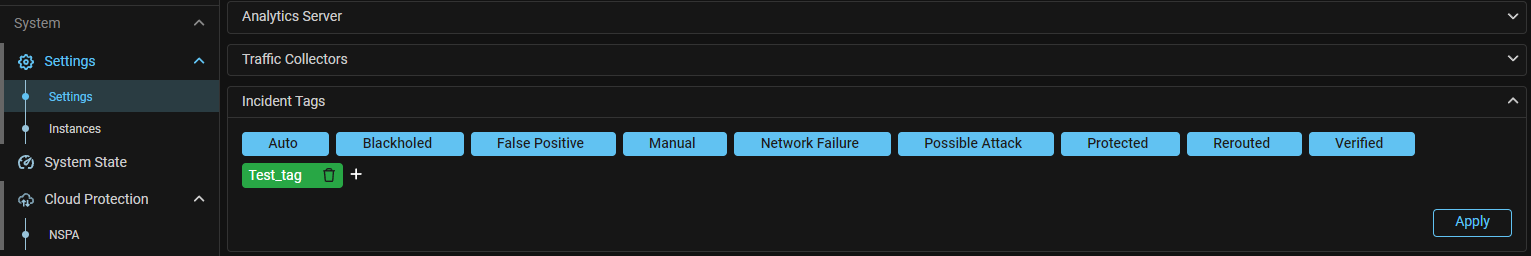
Incidents. Added incident tag management interface.
The “Incident Tags” card has been added to the “Settings” page. The panel allows to add, delete or change tags used to tag incidents. Only tags from the list can be assigned to an incident.
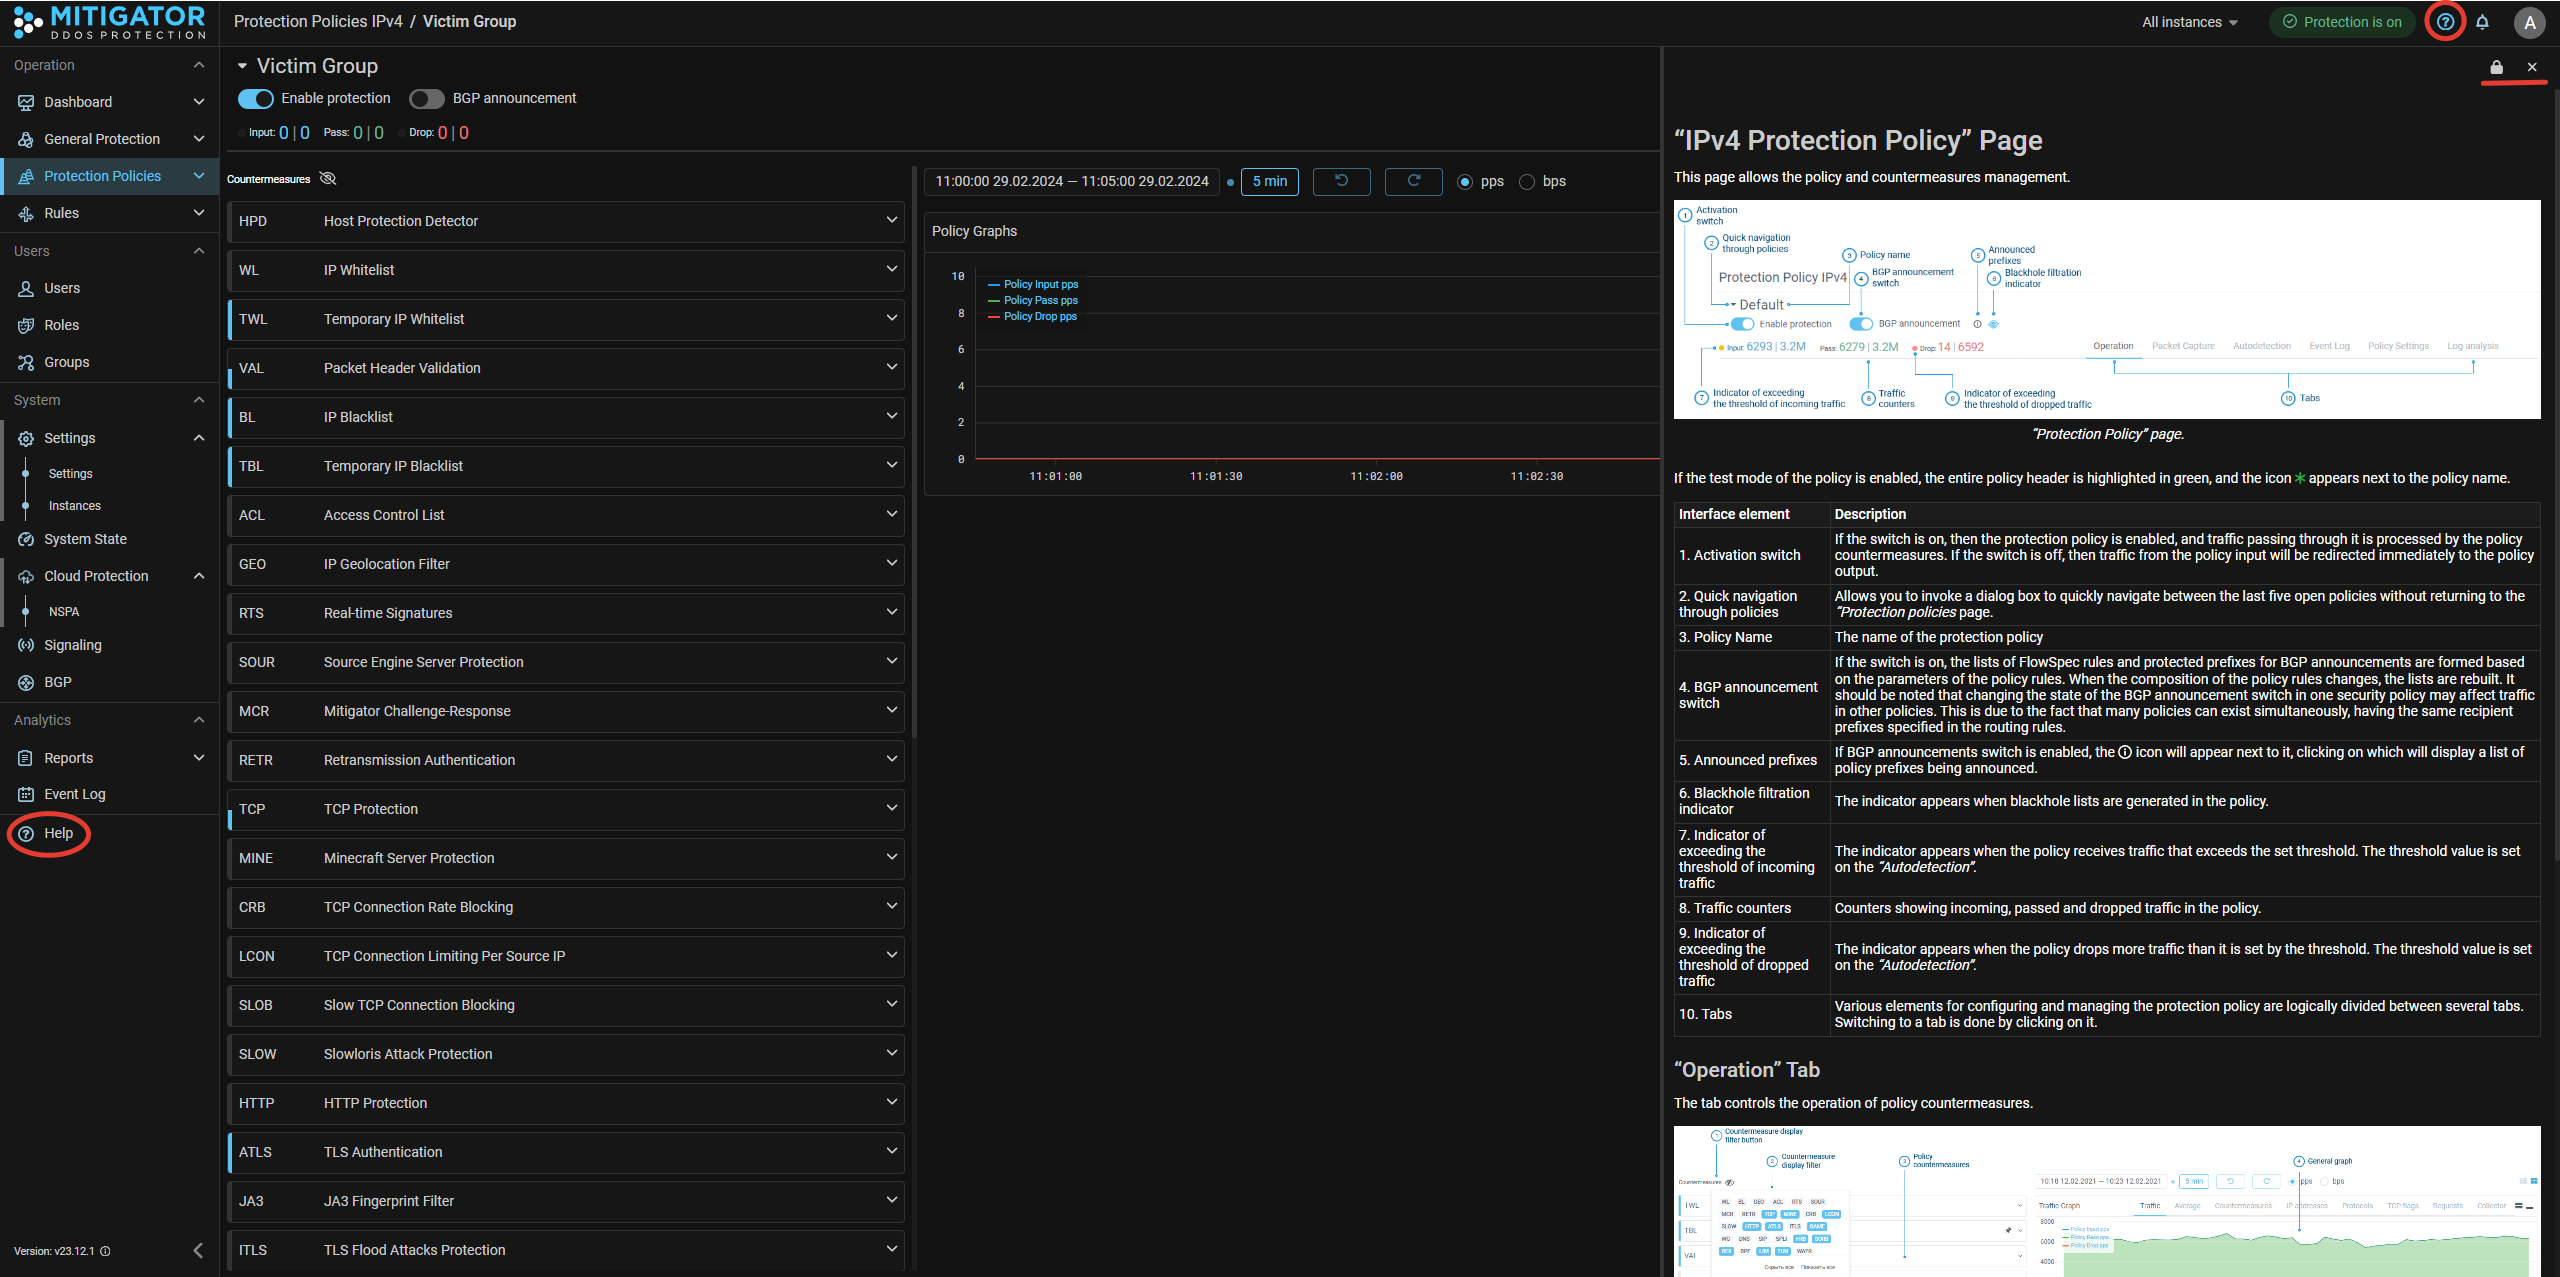
UX. Added built-in help for sections of the Web interface.
Now, without going to general help, you can see a description of the currently open page or tab. This is especially convenient for the Log Analysis and Flow Analysis tabs. Clicking on the question mark now opens not a complete help on the system, but only a description of the current page. General help has been moved to the main menu section. The size of the context-sensitive help window is customizable. The window can be firmly anchored to the page or shown only on hover. When switching between sections of the interface, the contents of the window change automatically.
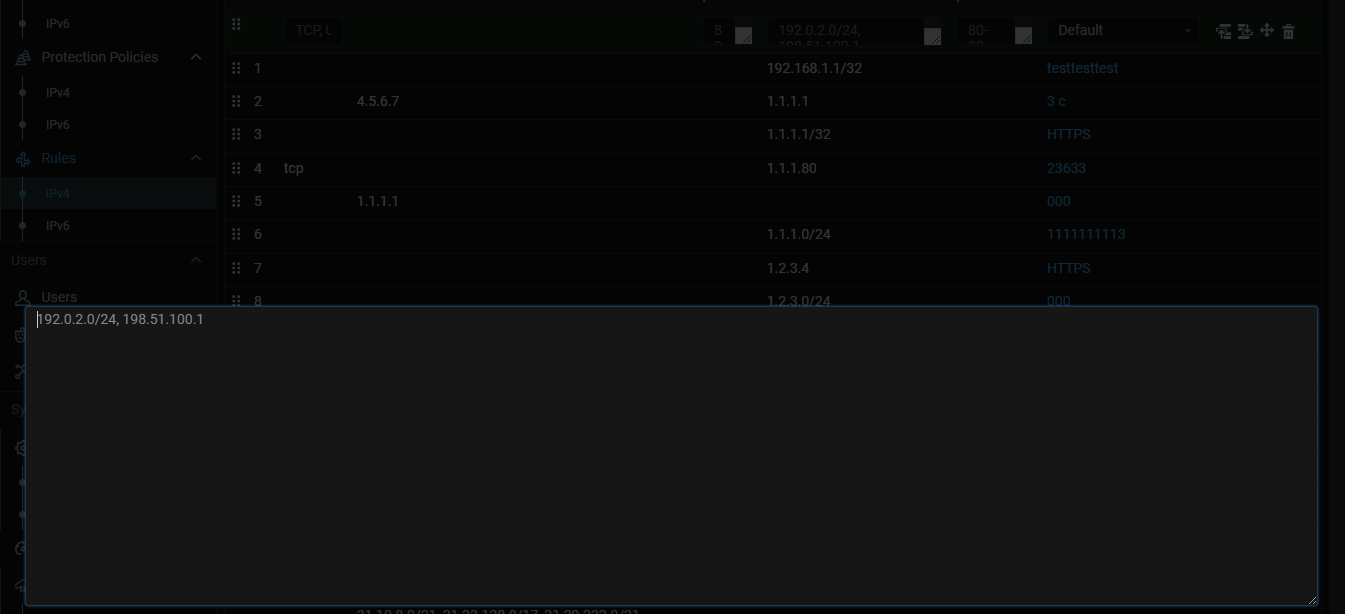
UX. Added expansion of multi-line fields.
Now multi-line fields, for example in the routing rules or ACL countermeasure,
can be expanded using the Alt+Enter key combination for ease of entering or
copying values.
UX. Added indication of unconfigured autodetection thresholds.
Now, if you switch a countermeasure to autodetection mode, but do not set any threshold for activation, the auto-detection indicator will be highlighted in yellow, and a corresponding warning will appear inside the countermeasure card.
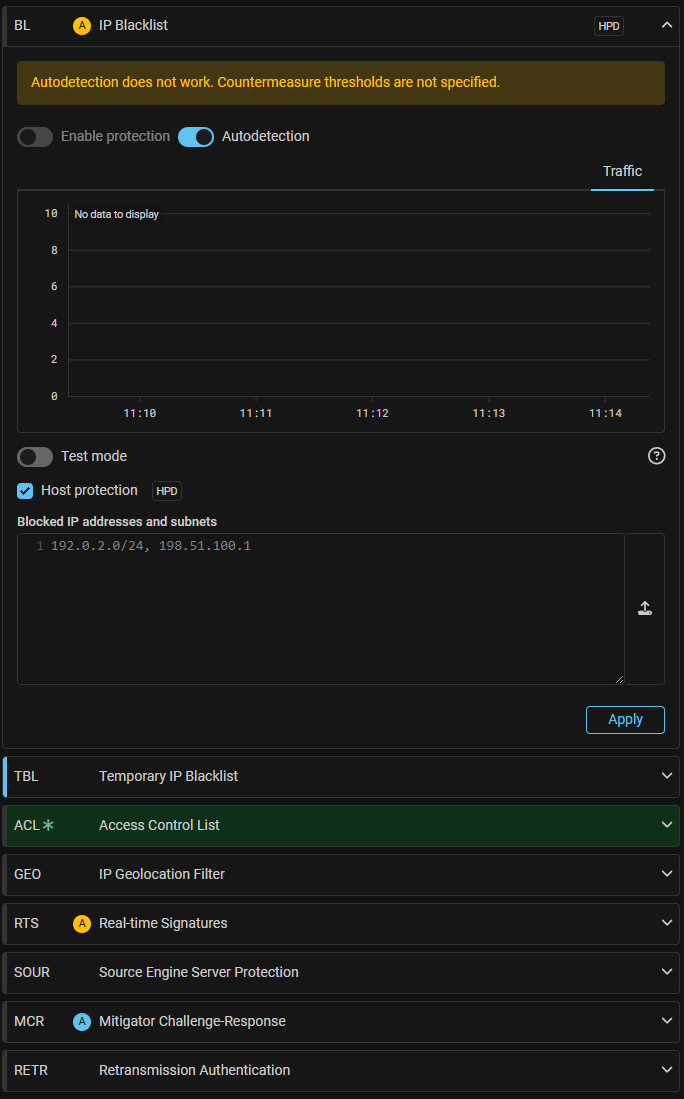
UX. Added an indication of operation in the host protection mode.
Now the countermeasures header displays an indicator of operation in the host protection mode.
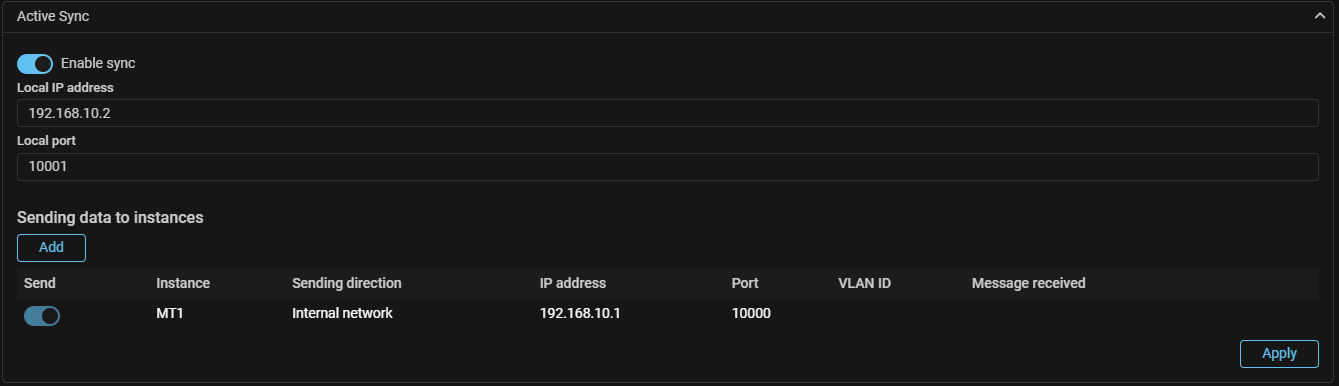
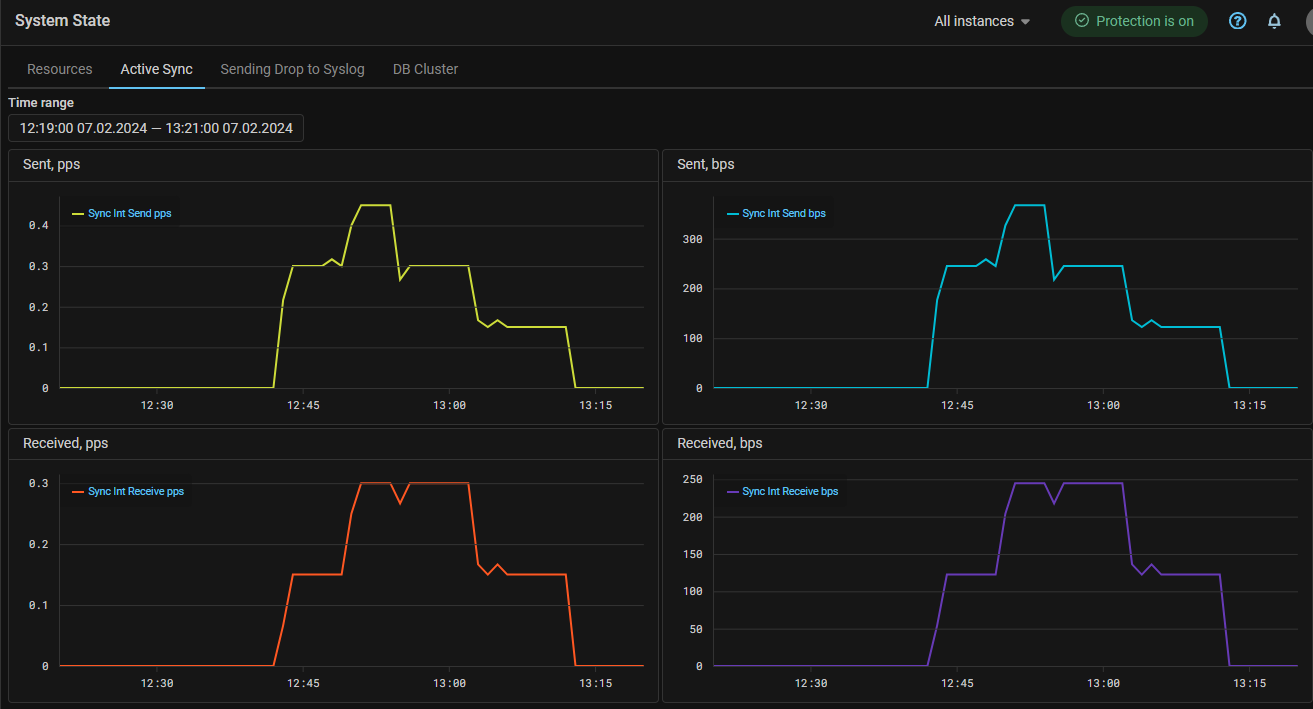
UX. Added active synchronization traffic graphs.
Added an Active Sync tab to the System State page. The tab displays graphs of traffic occurring between packet processors during active sync operation.
UX. Added graphs of traffic generated when sending messages of countermeasure drops via syslog.
UX. Color scheme reworked.
The colors of individual interface elements changed.