Multipurpose Analyzer
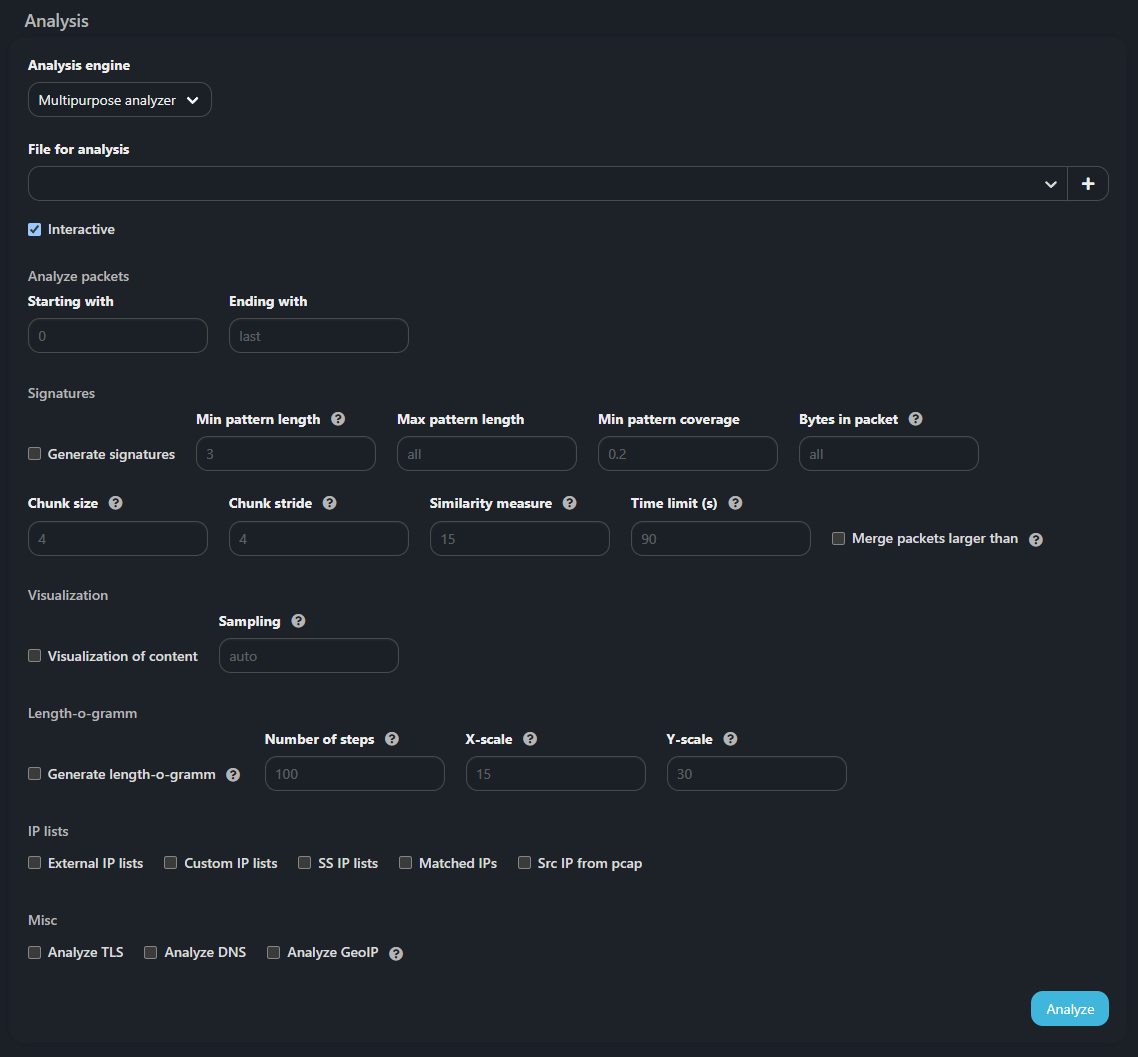
Analyzes L3/L4 headers and L4 payload.
You can specify the range of packets that will be analyzed by setting values in the Starting with and Ending with fields.
If a custom BPF filter is specified, then other filters are not applied.
The following checkboxes can be activated for this mechanism:
- Interactive — an interactive html report is formed instead of a text one;
- Generate signatures — add templates for L4 payload (ref. Signatures);
- Merge packets larger then — optimize the dump processing;
- Visualization of content — allows you to visually identify patterns in traffic (ref. Visualization of content);
- Sampling — only packets that are multiples of the specified value are used to build the visualization. For example, if 5 is specified, then every fifth package will be selected for rendering. In the automatic mode, the sampling value is determined by the engine in such a way as to evenly place the captured packets on the image with a maximum height of 200000 pixels;
- Generate length-o-gramm — generate a length-o-gramm (ref. Length-o-gramm);
- External IP lists — analyze against external reputation lists;
- Custom IP lists — analyze against custom reputation lists;
- SS IP lists — analyze against reputation lists from the analytics server;
- Matched IPs — show IPs that were found in at least one of selected reputation lists;
- Src IP from pcap — display in the report a list of unique source IPs from the analyzed PCAP file;
- Analyze TLS — add analysis of TLS messages;
- Analyze DNS — add analysis of DNS packets;
- Analyze GeoIP — add analysis by GeoIP databases.
Signatures
This mechanism generates templates for L4 payload in various ways.
Template types:
- Patterns per payload lengths;
- Variable-Offset Patterns;
- Fixed Byte Mask;
- Common Submask;
- Merged Submask;
- Bloom filter signatures.
See the Report section for a detailed description of patterns.
The user configures the following parameters:
- Min pattern length — the minimum number of bytes that describes the pattern;
- Max pattern length — the maximum number of bytes that describes the pattern;
- Min pattern coverage — the share of packets that the selected pattern should cover. For example, a value of 0.2 means a share of 20%;
- Bytes in packets — the length of the analyzed L4 payload from its beginning;
- Chunk size — the size of the elementary sequence for the Bloom filter in bytes;
- Chunk stride — the number of common bytes between the two nearest chunks;
- Similarity measure — a threshold number of common units between two Bloom filters to determine the similarity of packets;
- Time limit — the maximum time in seconds that the system will spend processing bloom filters.
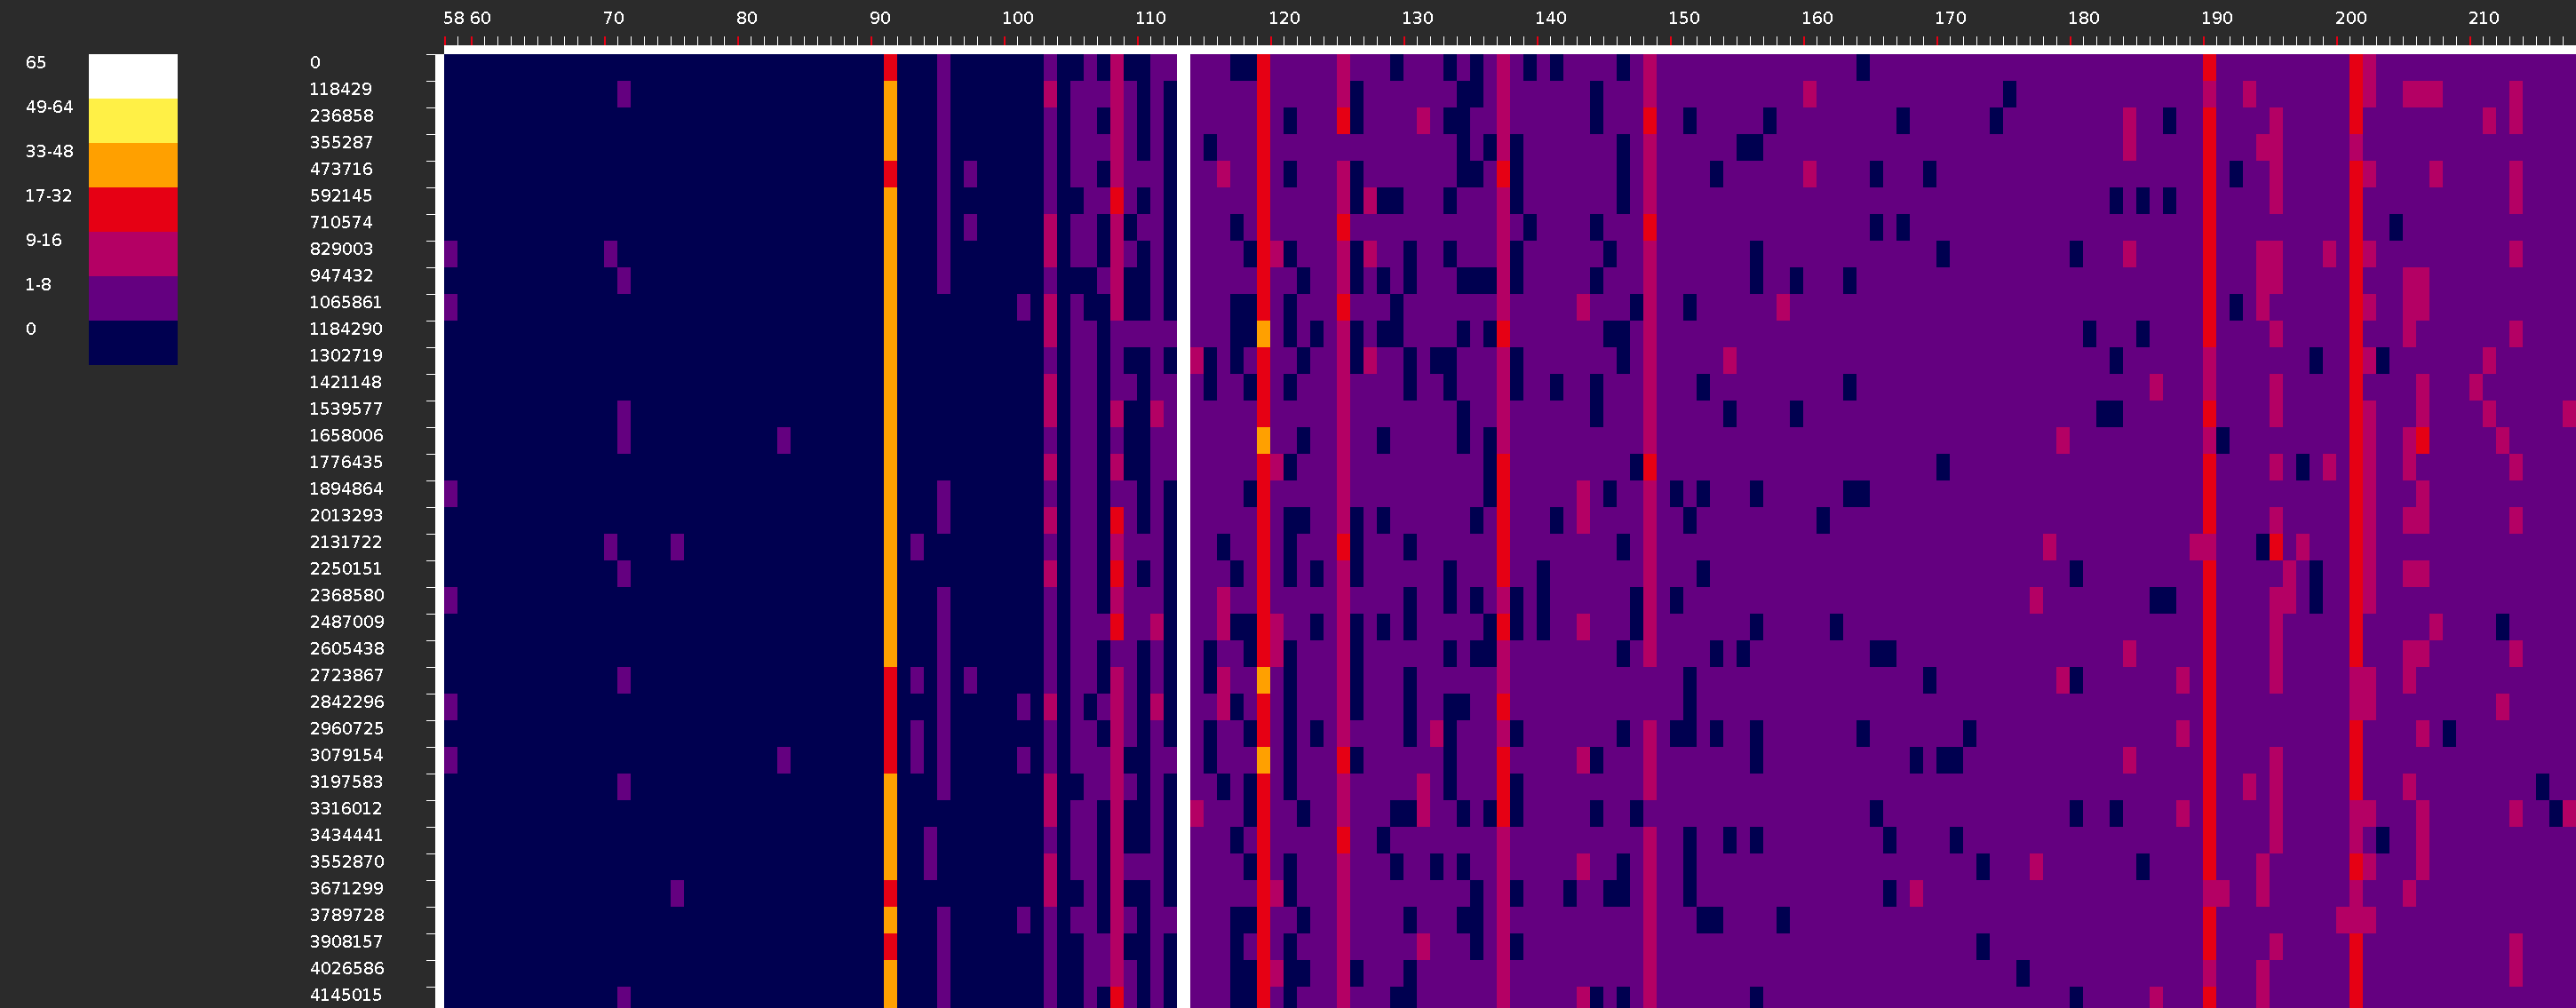
Visualization of content
Content visualization can be useful for understanding the traffic structure, as it allows you to visually identify patterns in it. The dump is represented as a graphic image, in which each line is L3/L4 packet data. Byte values are color coded. The visualization built during the analysis can be downloaded as an archive by clicking on the file icon or viewed in the browser by clicking on the histogram icon.

When downloading the archive, the user receives a set of dump visualization files:
- sampling#_gray256_sorted_L4.png;
- sampling#_gray256_sorted_L3_L4.png;
- sampling#_gray256_chrono_L4.png;
- sampling#_gray256_chrono_L3_L4.png;
- sampling#_color256_sorted_L4.png;
- sampling#_color256_sorted_L3_L4.png;
- sampling#_color256_chrono_L4.png;
- sampling#_color256_chrono_L3_L4.png.
The file name tells about the visualization construction method:
- sampling# — shows the sampling value, set by the user or automatically determined by the rendering engine;
- sorted — packages are sorted by payload size in ascending order;
- chrono — packets are arranged in the same order in which they are captured in the dump (i.e. if the image is rotated 90 degrees counterclockwise, then you get a classic representation of time graphs);
- L4 — only for L4 payload;
- L3_L4 — L3 headers + L4 headers + L4 payload;
- gray — representation in shades of gray (adjacent byte values visually differ insignificantly);
- color — representation in color (similar byte values are clearly distinguishable visually).
Color256_chrono_L4 visualization example:
 Gray256_sorted_L3_L4 visualization example:

When view in a browser, you can switch between different rendering methods. Four image options with capture time sort are on the left and four image option with payload size sort are on the right. The view area is divided into two parts, on the left is the visualization screen, on the right is the visualization map. The control buttons can be used to change the display scale and scroll speed. Next to the control buttons, the cursor coordinates and the value on the image at the specified point are displayed.

Length-o-gramm
The mechanism allows you to get a Length-o-gramm — an image showing the packets size distribution by their number over a certain time interval.
The vertical axis shows time intervals from the minimum to the maximum packet capture time in microseconds. The number of intervals is set in the Number of steps field. The horizontal axis shows the packet sizes in bytes. The color indicates the number of packets of a certain length in a certain time interval.
The size of a dot on a Length-o-gramm is set in pixels by specifying the values in the Scale in X and Scale in Y fields.
Similar to the chrono visualization, if the image is rotated 90 degrees counterclockwise, you get a more familiar representation for a spectrogram.
Report
The report can be generated as a text file or as an interactive html page if the Interactive checkbox is set. The content of the report does not depend on the presentation form, but the interactive version has some advantages and is more convenient to use, so the report description is based on it. The report consists of tabs, the information on which is grouped into categories. Tabs are displayed in the report only when data is available. Every tab is further divided into sections. Each section can be collapsed. Some sections have filtration, table export to CSV file or top.
Report tabs and sections:
Summary

- Packets total — number of packets in the dump;
- Capture begin — date and time of capture start;
- Capture end — date and time of capture end;
- Capture duration — capture duration.
Optionally, separate tabs in the report may contain:
- TLS packets — number of TLS packets in the dump;
- TLS ClientHello packets — number of ClientHello in TLS packets;
- DTLS packets — number of DTLS packets in the dump;
- DTLS ClientHello packets — number of ClientHello in DTLS packets;
- DNS packets — number of DNS packets in the dump.
Header
Analysis of common field values in IPv4 headers and transport protocols. Relevant if the attacker does not randomize protocol headers. Values are displayed only if the percentage of packets of a certain protocol in the dump is 5% or more. The distribution of fragmented packets with a non-zero offset in the IP header and the number of unique non-zero offsets are shown.
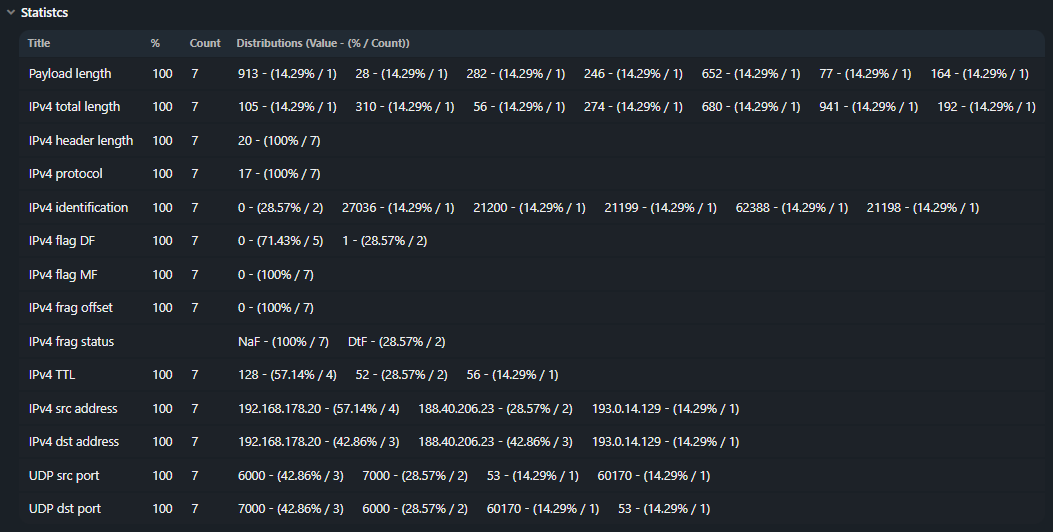
NaF – (Not a fragment);
Dtf – (Don't fragment);
IsF – (Is a fragment);
FF – (First fragment);
LF – (Last fragment).
Tables of TCP flags distribution by the number of packets are formed.
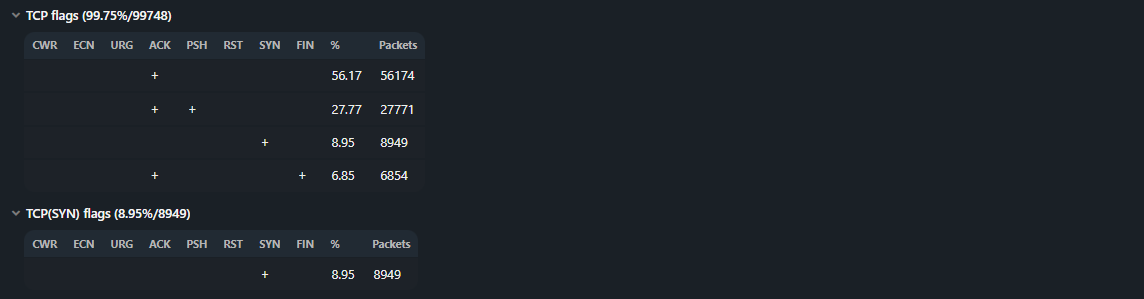
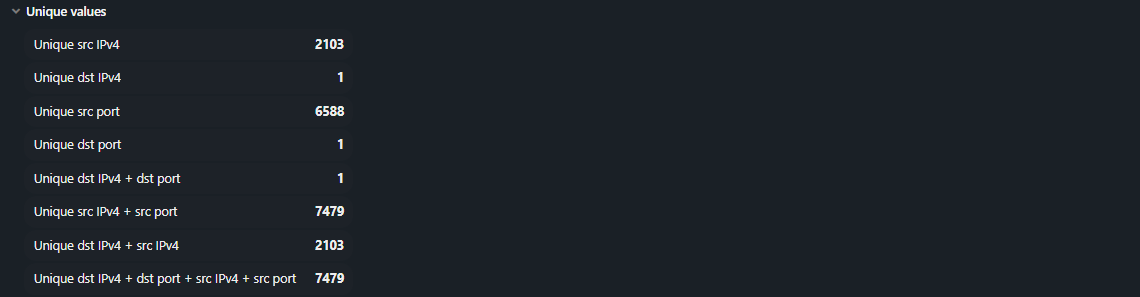
The distribution is formed by unique combinations of n-tuple.
Signatures
The section is generated in the report if the Generate signatures checkbox is set.
-
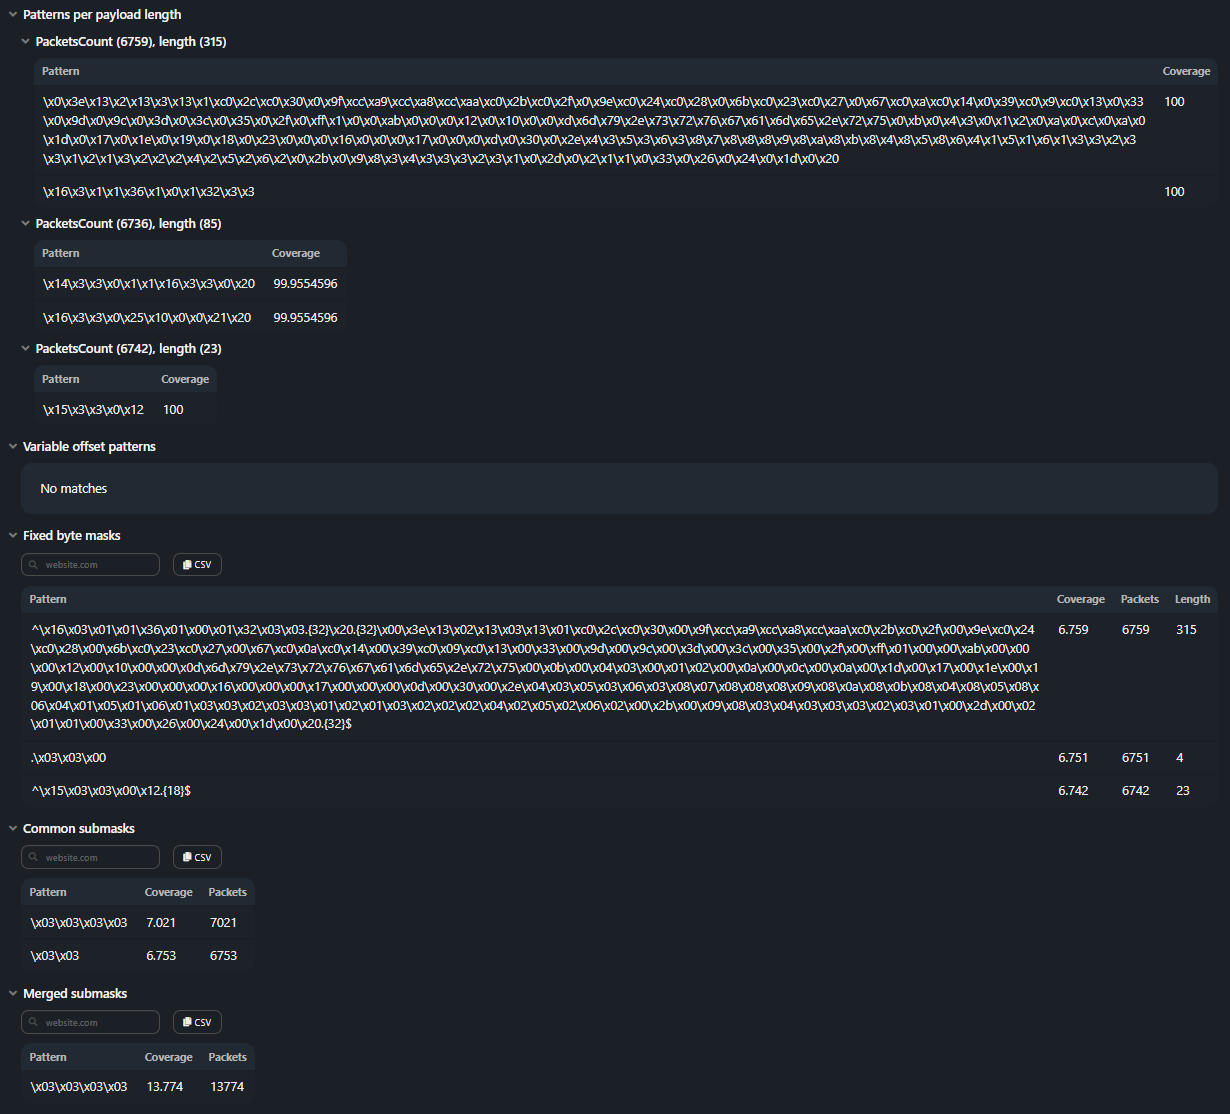
Patterns per payload lengths. Often observed patterns for packets with the most frequently occurring length.
-
Variable-Offset Patterns. Often observed patterns in payload with variable offset.
-
Fixed Byte Mask. Offsets with fixed byte value. A set of such offsets and their values forms a mask.
-
Common Submask. Similar masks are searched for (regular expressions have 50% match), and the common part extracts from them.
-
Merged Submask. Merged Submasks are formed by removing redundancy from common submasks, e.g. aabb is covered by aab.
GeoIP
The section is generated in the report if the Analyze GeoIP checkbox is set.
-
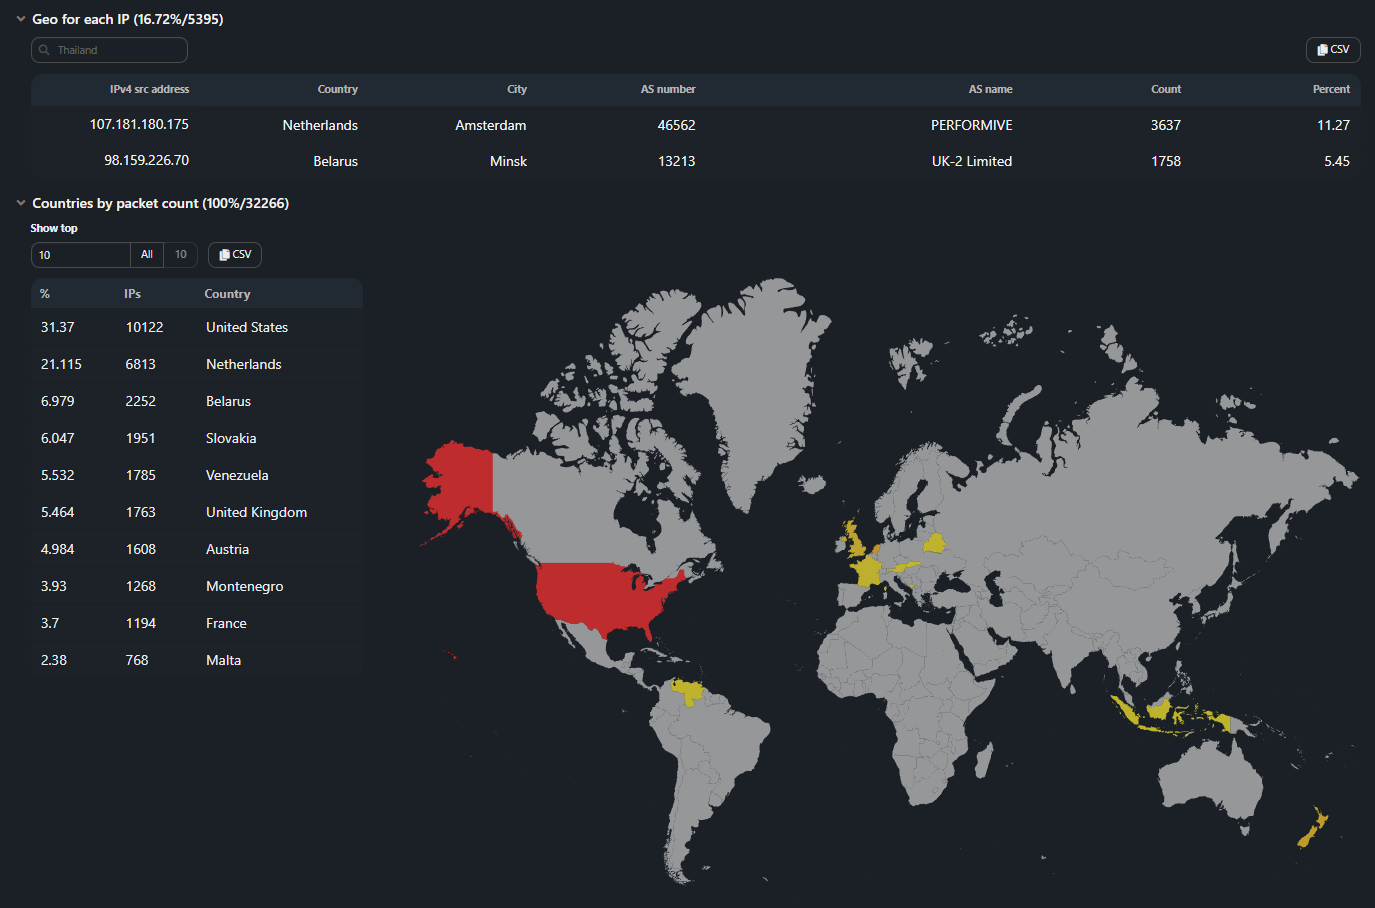
Geo for each IP. For the IP addresses of the uploaded dump, the corresponding country, city, AS number, AS name are displayed. Filtration for all table fields is available.
-
Country by packet count. Distribution of countries by the number of packets.
-
Country by IP count. Distribution of countries by the number of source IP addresses.
-
ASN by packet count. Distribution of AS by the number of packets.
-
ASN by IP count. Distribution of AS by the number of source IP addresses.
IP Lists
The section is generated in the report if the checkboxes responsible for analysis by reputation lists are set. Filtering by list names is available, using regular expressions, implemented through 2 input fields: Show and Hide.

-
IP lists analysis. The section contains a list of all IP addresses found in reputation lists.
-
Custom IP lists analysis. The section contains a list of all IP addresses found in additional reputation lists.
-
SS lists analysis. The section contains a list of all IP addresses found in reputation lists from analytics server.
-
Matched IPs. The section contains lists of IP addresses that were found in at least one of the previous reputation lists.
TLS
The section is generated in the report if the Analyze TLS checkbox is set.

-
TLS content type. Distribution of TLS messages by number of packets.
-
TLS length. Distribution by length of TLS packets.
-
TLS version. Distribution by TLS version.
-
TLS ClientHello number of unique cipher suits. Number of unique cipher suits in ClientHello messages.
-
TLS ClientHello unique cipher suits. List of unique cipher suites.
-
TLS ClientHello cipher suits (by sets). Distribution of Client Hello across a combination of cipher suites.
-
TLS ClientHello number of unique extension. Number of unique extensions.
-
TLS ClientHello unique extensions. List of extensions.
-
TLS ClientHello extensions (by sets). Distribution of Client Hello across a combination of extensions.
Similar statistics are given for DTLS over UDP.
-
DTLS content type. РDistribution of DTLS messages by number of packets.
-
DTLS length. Distribution by length of DTLS packets.
-
DTLS version. Distribution by DTLS version.
-
DTLS ClientHello number of unique cipher suits. Number of unique cipher suits in ClientHello messages.
-
DTLS ClientHello unique cipher suits. List of unique cipher suites.
-
DTLS ClientHello cipher suits (by sets). Distribution of Client Hello across a combination of cipher suites.
DNS
The section is generated in the report if the Analyze DNS checkbox is set.
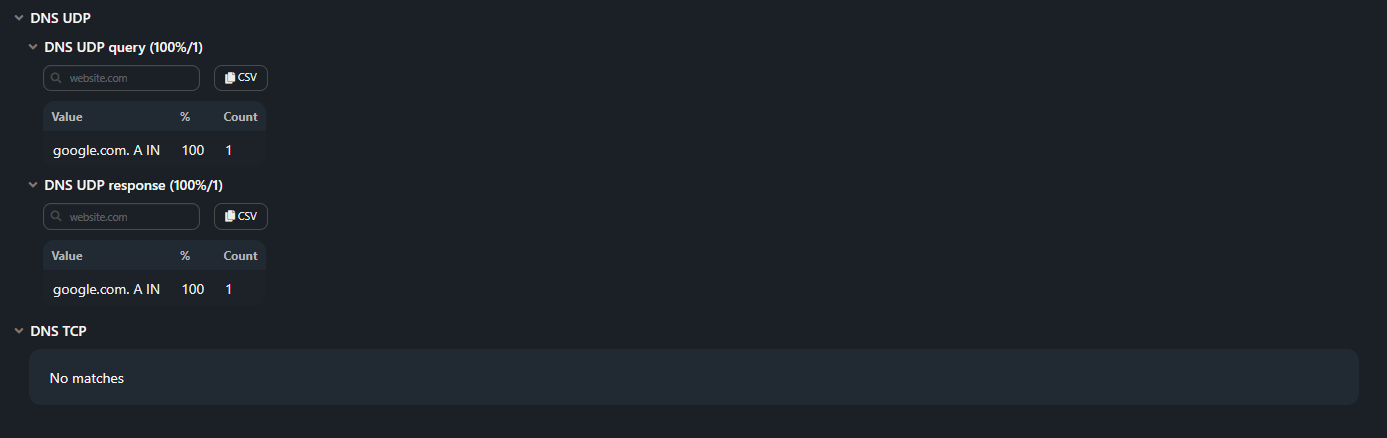
The data in the report is grouped in triplets, each containing a domain name, a class, and a query type. The percentage of packets in each category is taken from the total number of DNS packets in the dump. To display a triple in the report, the number of DNS packets of one set must exceed 5% of the threshold of the number of DNS packets of the category.
-
DNS UDP query. Distribution of DNS packets with query message type sent over UDP.
-
DNS UDP response. Distribution of DNS packets with response message type sent over UDP and related to the questions section.
-
DNS TCP query. Distribution of DNS packets with query message type sent over TCP.
-
DNS TCP response. Distribution of DNS packets with response message type sent over TCP and related to the questions section.