Access to the Grafana interface
MITIGATOR comes with Grafana which can be used to create custom dashboards. See the Grafana documentation to understand exactly how to do this.
To gain access to the Grafana web interface, you need to set up the service, which is disabled by default. You can temporarily do this with the following command:
docker-compose up -d --scale grafana=1 grafana
To enable grafana permanently, you need to change scale from 0 to 1
in docker-compose.yml.
services:
  ...
  grafana:
    ...
    scale: 1
    ...
After configuration, you need to raise the Grafana container:
docker-compose up -d grafana
Now you can access the web interface using the forwarded port:
http://mitigator.local:3000 (mitigator.local is the server address here
and below). The default username and password are admin:admin.
Grafana will ask you to change your password the first time you log in.
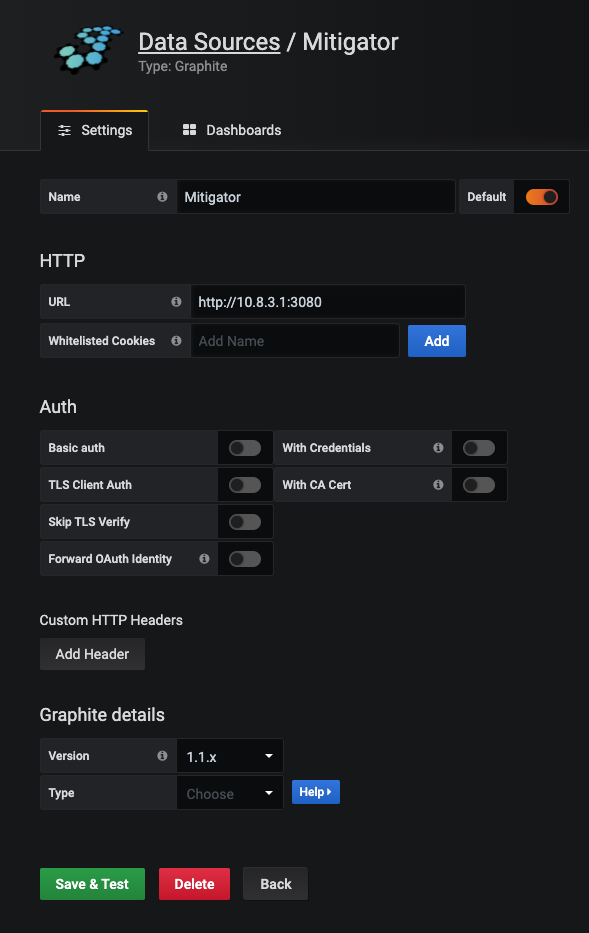
When using a cluster, you must explicitly set the address of Graphite inside the VPN to Grafana:

All changes made through the Grafana interface, including dashboards,
are saved in its internal database, which is stored in the
/var/lib/docker/volumes/mitigator_grafana/_data directory.
With these settings, Grafana is available on all server IPs, that is, if the IP is public, it is available on the entire Internet. The options to secure Grafana are given below.
Option 1: SSH port forwarding
If Grafana users can connect to the server via SSH, you can only allow local connections to Grafana and forward the port.
Binding to an address (after that, you need to recreate the container again):
version: "2.2"
services:
  gateway:
    ports:
    - "127.0.0.1:3000:3000"
SSH port forwarding:
ssh -L 3000:127.0.0.1:3000 mitigator.local
Address for accessing the Grafana interface: http://localhost:3000
Option 2: local network
If the IP of the internal trusted network is used, you can bind a port to it in the same way as in option 1. The address for accessing the Grafana interface will be http://mitigator.local:3000.
Option 3: firewall
Configure any necessary firewall restrictions on the server itself or on the network perimeter. Refer to the distribution and/or ITU documentation for instructions.